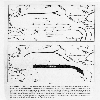
 Figure 1 -
Relationship between the Southern Ocillation and El Nino. Lutgens, Frederick K., and Edward J. Tarbuck, 1986: the Atmosphere.
An Introduction to Meteorology. Prentice Hall Inc., Englewood Cliffs, NY. pg 214.
 Figure 2 - Weather Changes
Related Class Images
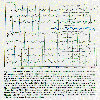 Time series of selected variables whose interannual variability is related to the ENSO phenomenon.
 Sea-surface temperature anomalies from 1968 - 1984.
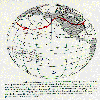 A schematic diagram of the PNA pattern of middle and upper-tropospheric geopotential height anomalies during a NH winter that coincides with El Nino conditions.
 Cross section of the current system off the Peruvian coastline.
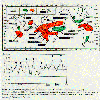 Schematic diagram of areas and times of the year with a consistent ENSO precipitation signal and monthly tropical sea surface and land air temperature anomalies 1961-1989.
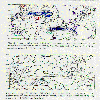 Average May-June 1988 SST anomalies and average May-June 1988 OLR anomalies.
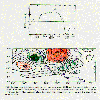 Average geopotential height anomalies at 300 mb for April-May-June 1988.
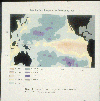 Sea surface temperature anomalies
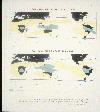 Calculated OLR for DJF 1982-1983
 Observed SSTA for December 1991
 Contours of the composite SST anomaly taken from ship track data angenerated by the six El Ninos between 1949 and 1981.

