


| Potential impacts of climate change on agriculture | |
|
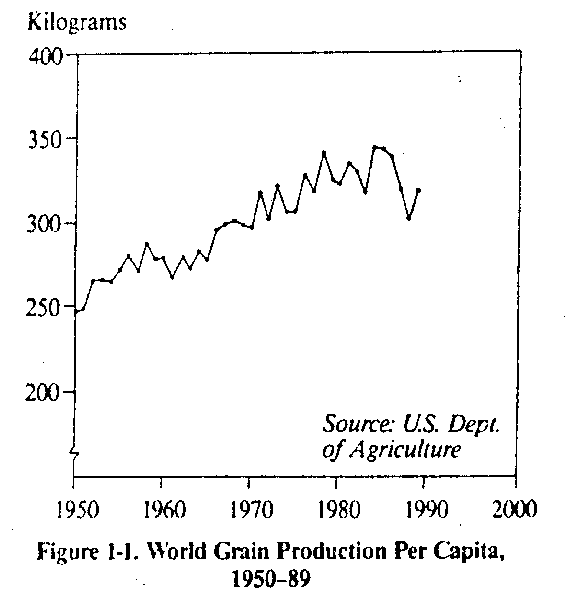
World grain production per capita. |
|
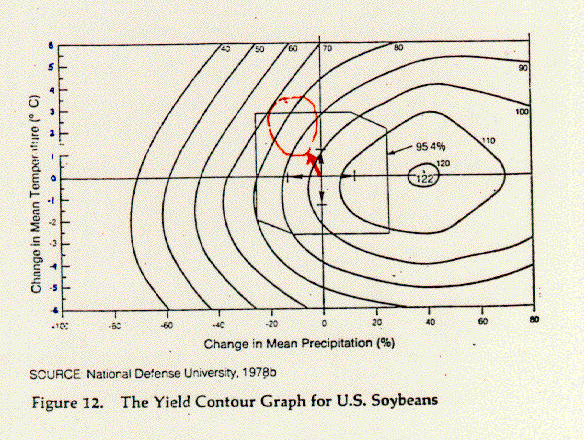
Yield contour graph for soybeans. |
|
Yield contour graph for corn. |
|
Summary flow chart. |
|
Yield change projections under different environmental scenarios for soybeans. |
|
Yield change projections under different environmental scenarios for maize. |
|
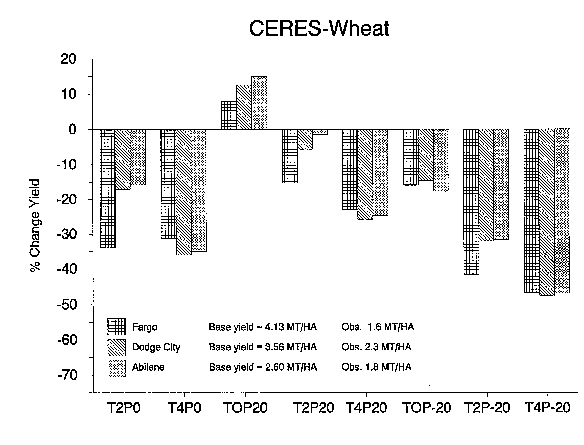
Yield change projections under different environmental scenarios for wheat. |
|
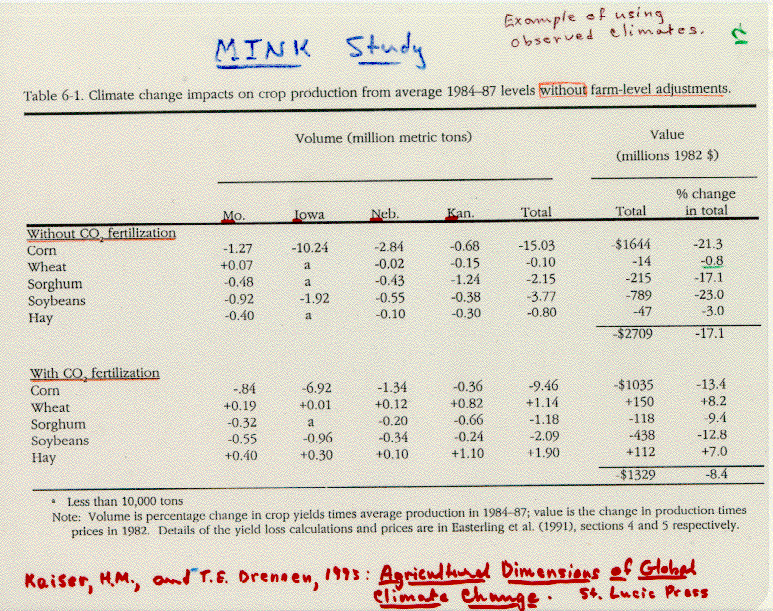
Climate change impacts on crop production without farm level adjustments. |
|
Climate change impacts on crop production with farm level adjustments. |
|
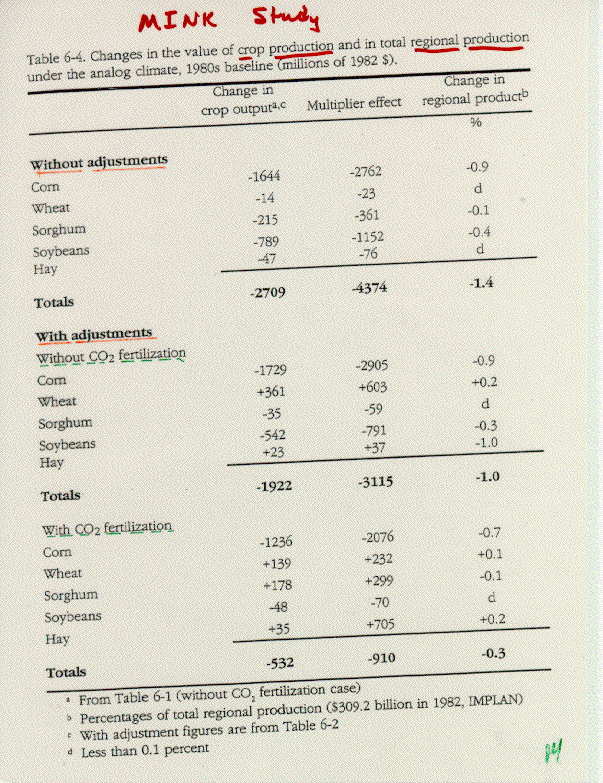
Change in the value of crop production. |
|
Epa climate change project sites. |
|
Percent change in corn yields. |
|
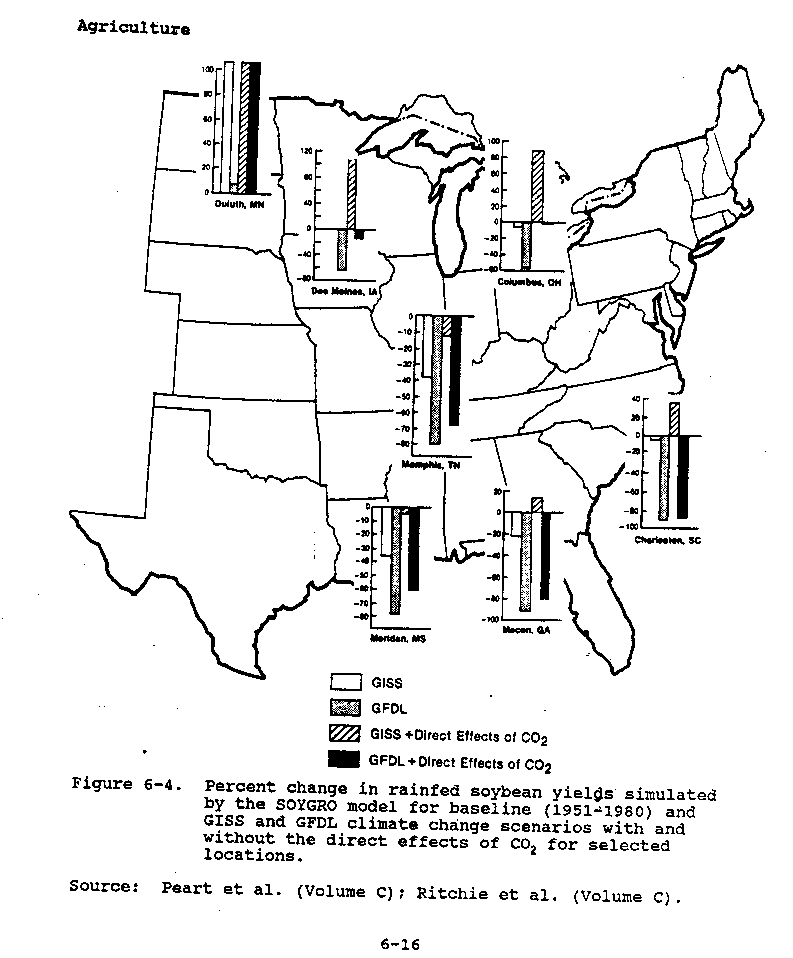
Percent change in soybean yields. |
|
Response to temperature as simulated by SOYGRO. |
|
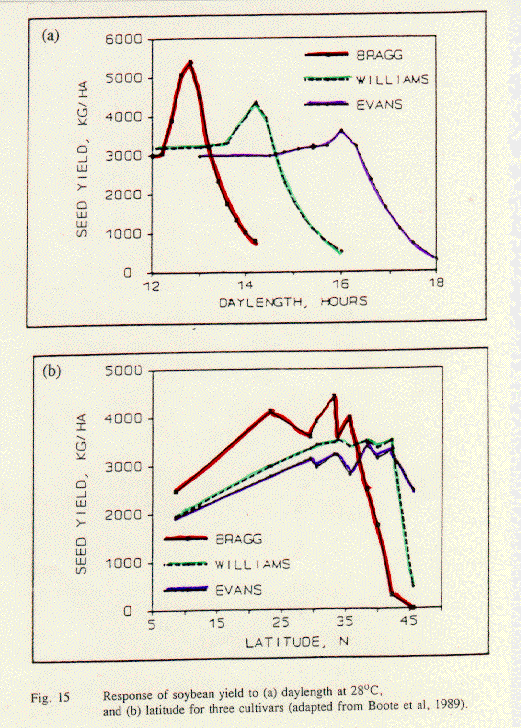
Response to daylength and latitude as simulated by SOYGRO. |
|
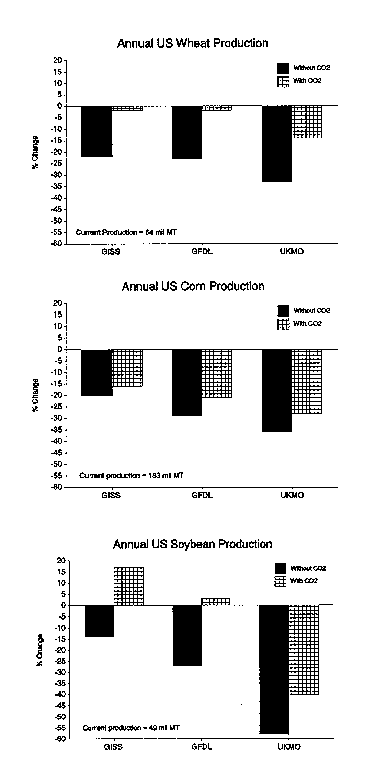
Annual US wheat, corn and soybean production. |
|
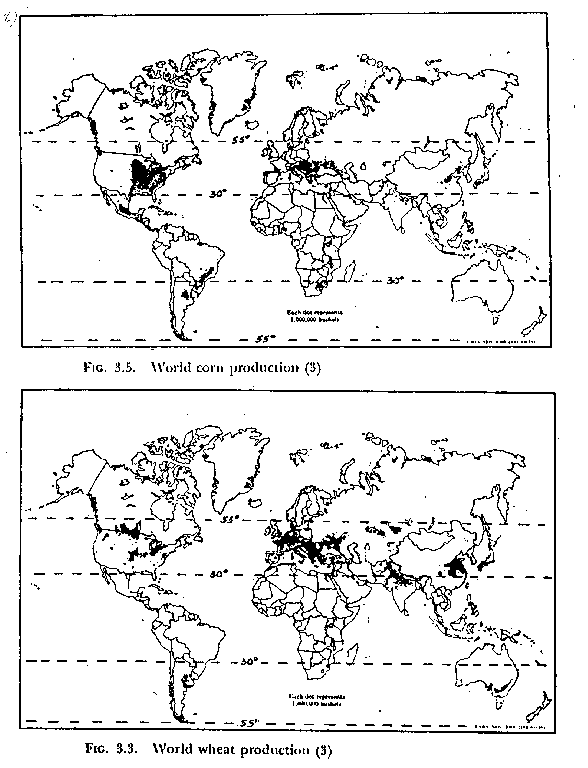
World corn and wheat production. |
|
US EPA report. |
|
Crop model sites and modelers. |
|
Modeled 2xC02 production changes for maize. |
|
Modeled 2xC02 production changes for wheat. |
|
Modeled 2xC02 production changes for soybeans. |
|
Percent change in average national yield with a doubling of atmospheric C0 concentration. |
|
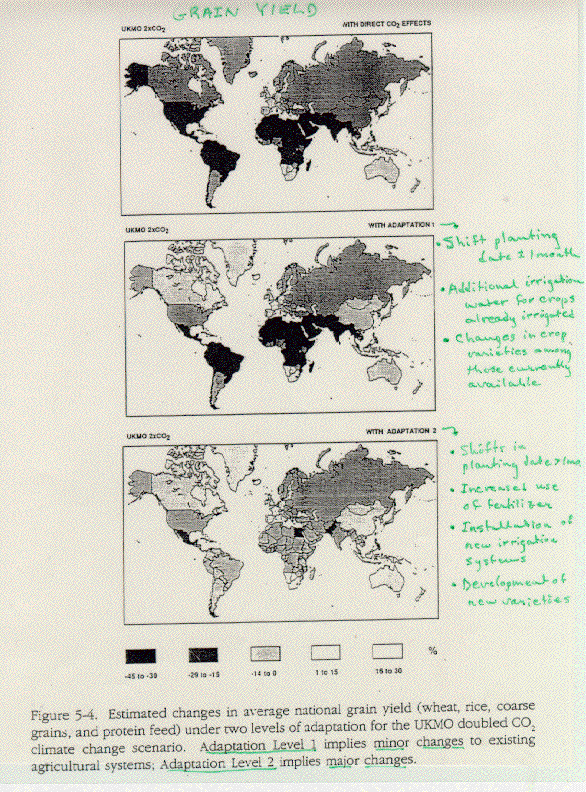
Estimated change in average national grain yield. |
|
Estimated change in average national grain yield under 2 levels of adaptation. |
|
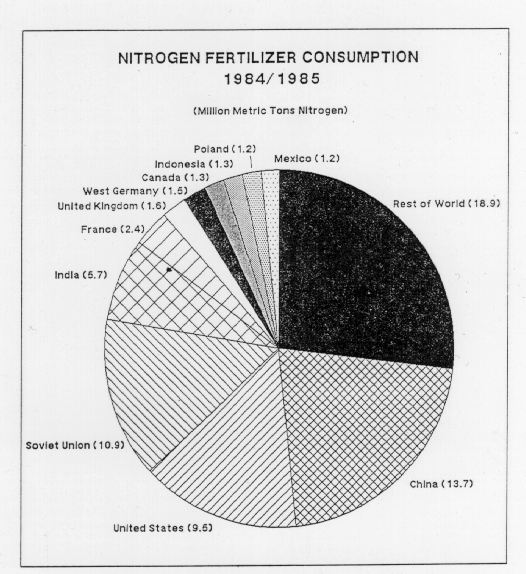
Nitrogen fertilizer consumption. EPA. |
