Analysis of Damaged Railcars from the Tuscaloosa-Birmingham, AL Tornado of 27 April 2011
Chris Karstens
In communication with NWS Birmingham
| The Tuscaloosa-Birmingham tornado of 27 April 2011 was assigned an EF-4 rating based on a limited number of EF-scale damage indicators available throughout the nearly 80 mile long track. Damage surveys conducted by the NWS Birmingham and other tornado damage experts (e.g., Jim LaDue, Tim Marshall) identified a few damage indicators not present in the current EF-scale document. These non-standard damage indicators have raised questions about what wind speeds were necessary to cause the level of observed damage to these structures, and if this could be determined with some level of confidence, could it affect the EF-rating assigned to this tornado. This web page describes one of these indicators; a line of empty railcars used for transporting coal. These were located in the western suburbs of Birmingham, AL. The interactive map above shows oblique aerial images taken by Google within a few days after the event. The controls in the upper left may be used to zoom and rotate the field of view to get one of four different aerial perspectives. |


|
Using Google's aerial oblique imagery combined with the National Geodetic Survey's aerial vertical imagery
taken around the same time period, a forensic analysis of the damaged railcars was performed. The arrows shown on the images above denote the prevailing wind direction
believed to have been present to cause the obseved damage.
There are a few important things evident. First, it appears most of the railcars slid off of the tracks toward the west, meaning winds on the upstream side of the tornado most likely caused this to occur (red arrows). Second, it appears three railcars were detacthed from the line (yellow text). The end location of two of the railcars, previously located very near the line of maximum tree damage, is clearly evident. It appears that winds on the back side of the tornado caused these railcars to be removed from their original location (blue arrows). However, from the aerial photos it is not clear whether these railcars were lofted and thrown or were rolled the indicated distance. Based on the orientation of these railcars, I would suspect that rolling is more probable. Four small panels accompany the path of the railcar that moved approximately 120 m, and both railcars appear pretty evenly damaged; I believe these observations support this notion of rolling. In discussions with NWS BMX, however, there are third-hand eye witnesses of railcars being lofted in the air for a good distance and there were no apparent ground marks that would suggest rolling occurred. So, it is quite possible that these railcars were indeed lofted and thrown. Near the location where these two railcars became detached, aerial oblique photos taken from the north show something interesting that happened to two of the remaining railcars (Fig. 2). These railcars appeared to 1) slide off the track toward the west due to winds on the upstream side of the torando, and then 2) tilt over toward the east due to winds on the back side of the tornado. The tilting direction of these railcars support the notion of the rolled railcars originating from this side of the line (as indicated by the black arrows). Other railcars that initially slid off the track did not show this secondary tilting. It is believed that when these other railcars intially slid off the track and fell on one side, a significant reduction in the aerodynamic drag occurred. Thus, it would take a substantial amount of lateral/vertical force to induce any further movement. Because these two railcars were located very near the line of maximum damage, it is likely that the strongest lateral/vertical forces were exerted on the railcars in the location and were sufficient to cause this secondary tilting of the railcars. The location of a possible third detached railcar is uncertain (could not be located in any of the photos), and has led to speculation on what occurred here (yellow ?). In discussion with NWS BMX, all railcars were accounted for following the tornado. Therefore, it is probable that this railcar never existed and there was merely a gap between the railcars at this location prior to the tornado. It is also possible that when the railcars along the curve fell down toward the inside of the arc, prevailing winds from the north or northeast caused the 6 remaining railcars on the east side to move southward down the track before being slid off the track. Or, perhaps the compressional force caused by the railcars falling toward the inside of the arc led to a separation and slight movement of the railcars at this location. As mentioned previously, questions have been raised about how strong the winds were in this location, based on the railcar damage (primarily the railcars that were moved from their original location). For a rough estimate, the following empirical relationship may be applied: 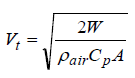
where Vt is the maximum tangential wind speed (ft sec-1), W is the weight of the object (lbs), ρair is the density of air (0.0026 slugs ft-3), Cp is the estimated pressure coefficient induced by the pressure drop inside the tornado, and A is the top surface area of the object (ft2). The NWS Birmingham estimates that each railcar (empty) weighs approximately 35 to 36 tons. The Cp is unknown, but can be estimated from laboratory vortex measurements. Because the railcars that were moved were located very near the max damage line, which is perhaps very near the tornado center, Cp is probably fairly substaintial. For now, we'll assume Cp=-1.6, but recognize this is highly uncertain. The value of A depends on whether the railcar was upright (621 ft2) or laying on its side (720 ft2). These values were obtained using NGS's aerial vertical photos. The values for each variable have been summarized in the table below, which shows the maximum and minimum values for Vt that could be obtained using various combinations of the values estimated for each variable.
This rough estimate yields Vt in the EF-3 range. To help substaintiate this result from an observational perspective, we look to other nearby damage indicators. Perhaps the most obvious DIs to assess are the nearby trees. According to the EF-scale, we should see trees that have been uprooted, snapped, and de-barked in proximity. Evidence of all three of these degrees of damage is located immediately upstream of the railcars, as shown on the right side of Fig. 2 above. Damage to residential structures occurred more than 1 km upstream or downstream of this location. The highest EF-rating assigned to the closest upstream DI was EF-4 (residential structures), while the highest EF-rating assigned to the closest downstream DI was EF-2 (residential). Thus, the EF-3 estimate to the railcars seems to fit well with nearby EF-scale DIs. Perhaps one major drawback to estimating winds in this manner is the assumption that Vt = V, with no account for the radial wind speed, Vr. Given the substantial amount of forest canopy, built structures, and the rolling topography, it is likely that the near-surface winds had significant Vr component. It is unknown how this could affect the results, however. |
|
|
|
| Figure 3. Observed Digitized Tree-fall | Figure 4. Observed Tree-fall Normalized to Max Damage Line | Figure 5. Mean Cross-Section of Normalized Observed Tre-fall |
|
In addition to estimating the winds using the empirical formula above, an attempt was made to estimate the near-surface winds using a technique that analyzes patterns
of tornado-induced tree-fall (Karstens et al. - in review). This technique is similar to the one developed by Holland et al. (2006) and Beck and Dotzek (2010).
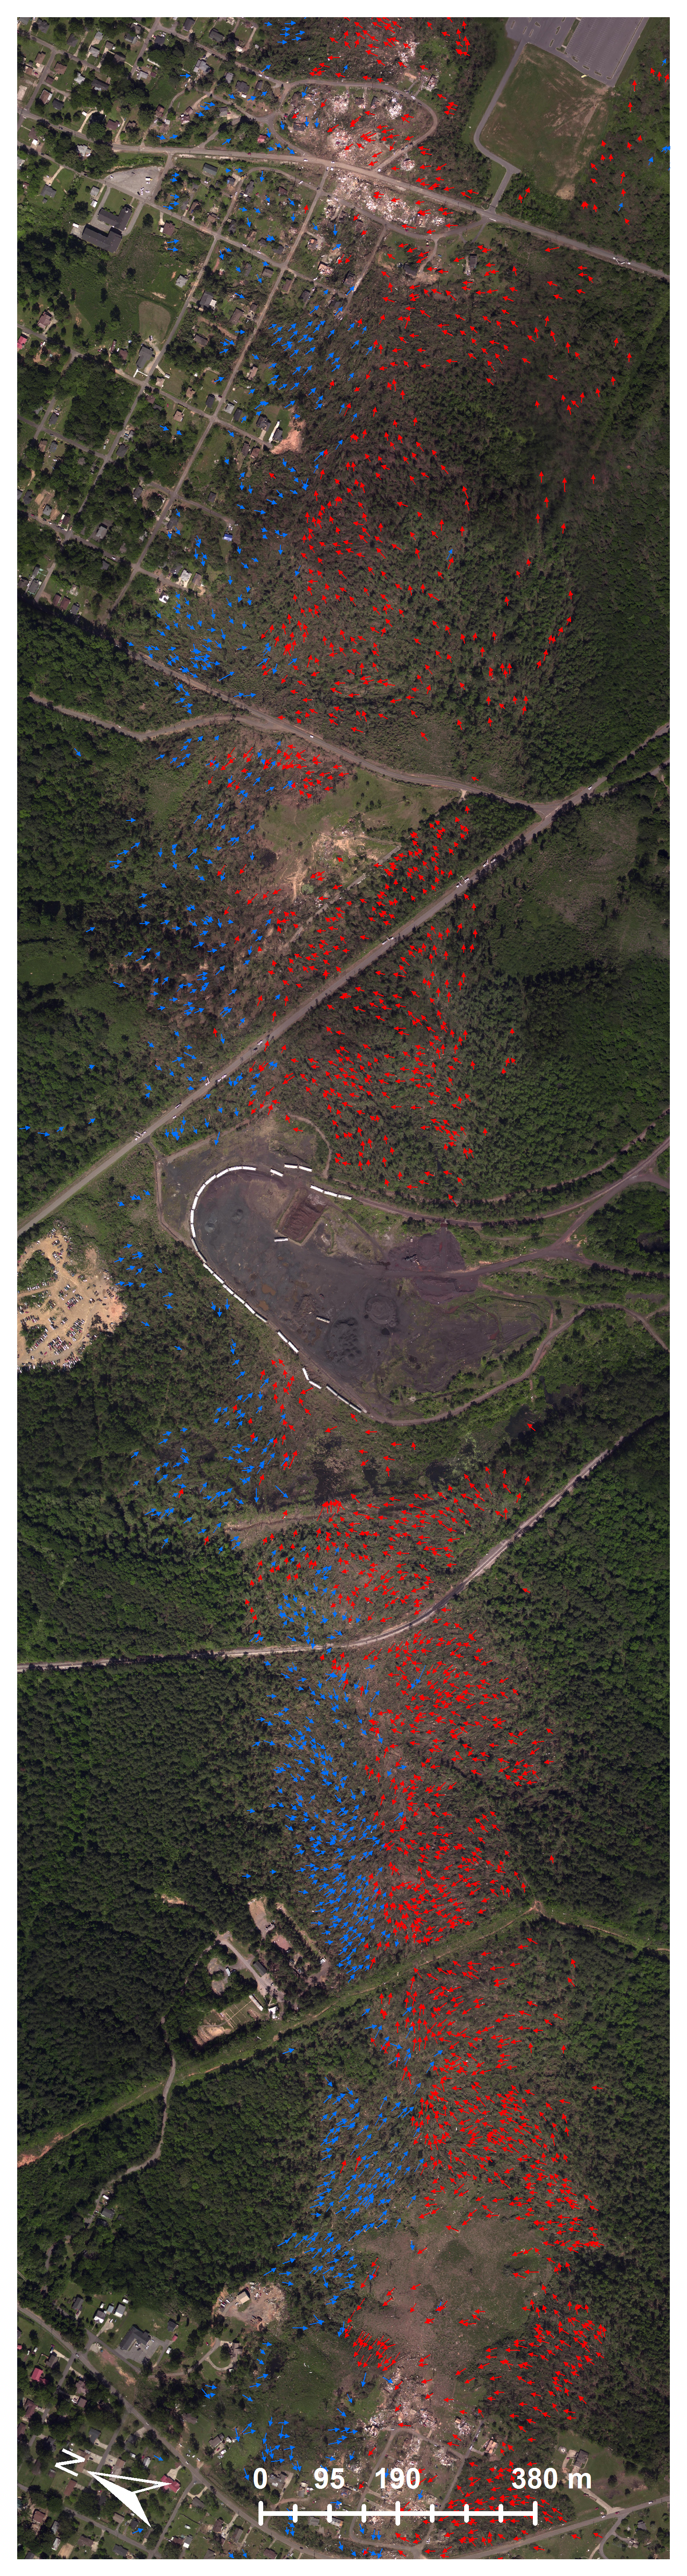
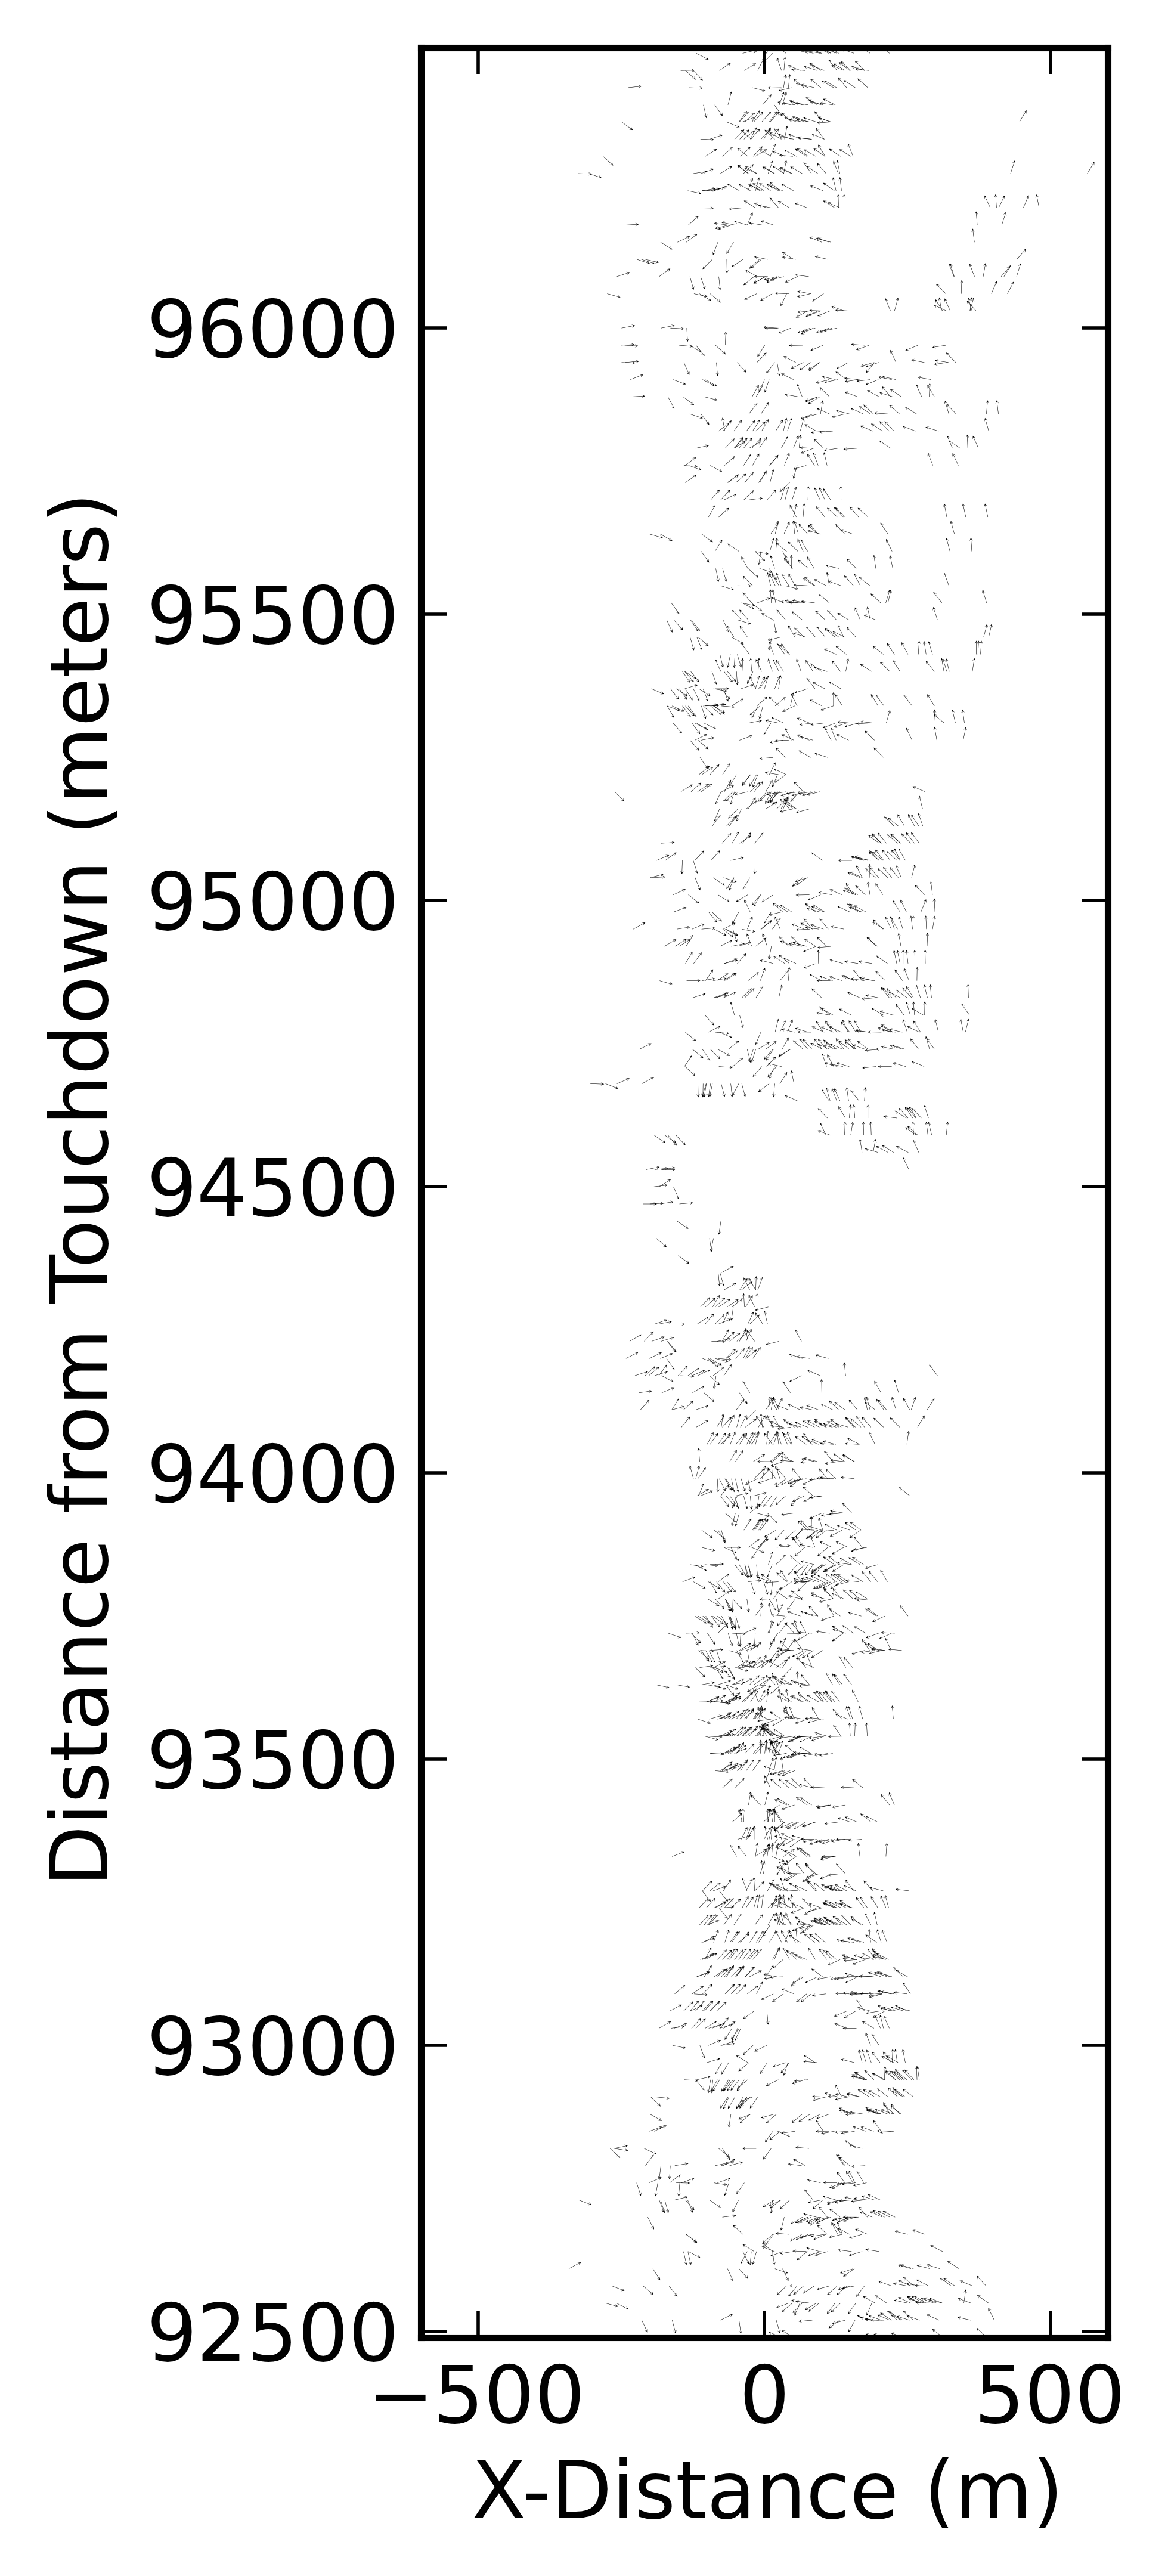
To start, observed tree-fall are digitized from aerial photography in some zone of the track, here about a 5 km region bounding the location of the railcars (Fig. 3).
These fallen trees are normalized based on 1) their distance from the line of maximum
damage, and 2) the approximate tornado translation direction (Fig. 4) to give the appearance of a south-to-north translating tornado.
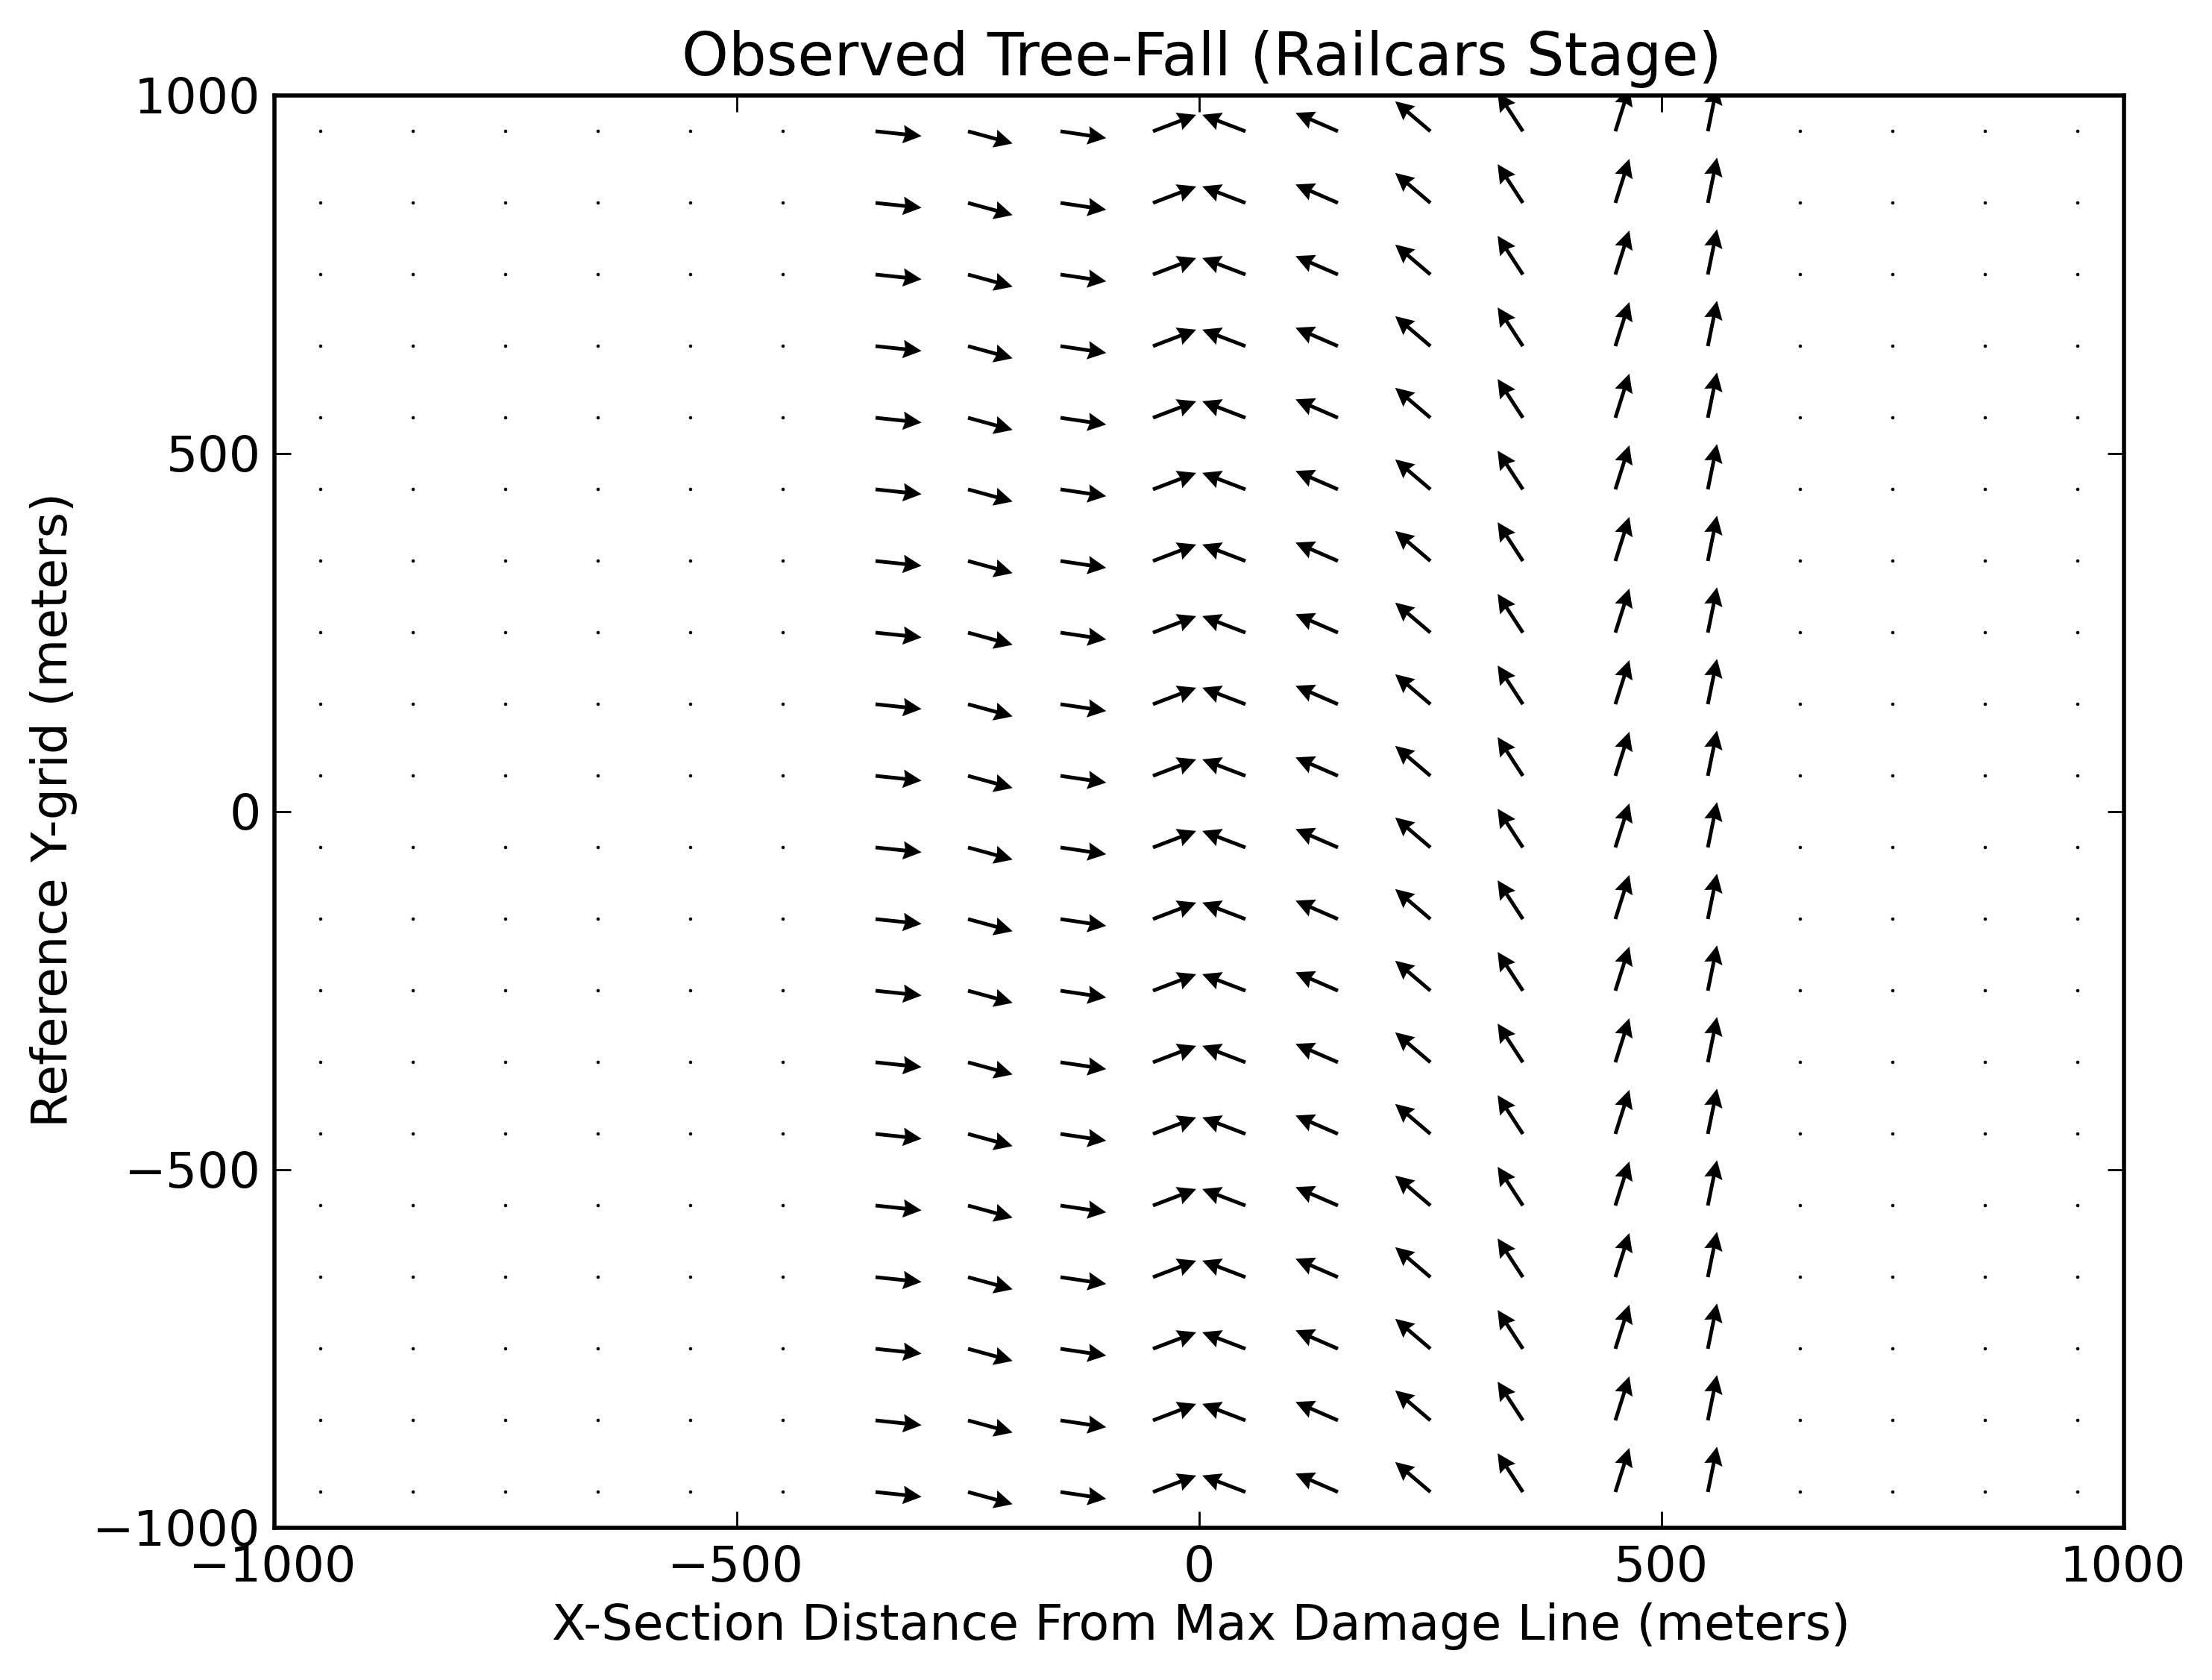
Then the fallen trees are grouped into 100 m wide bins, based on their distance from the line
of maximum damage, and the average fall direction in each bin is computed (Fig. 5).
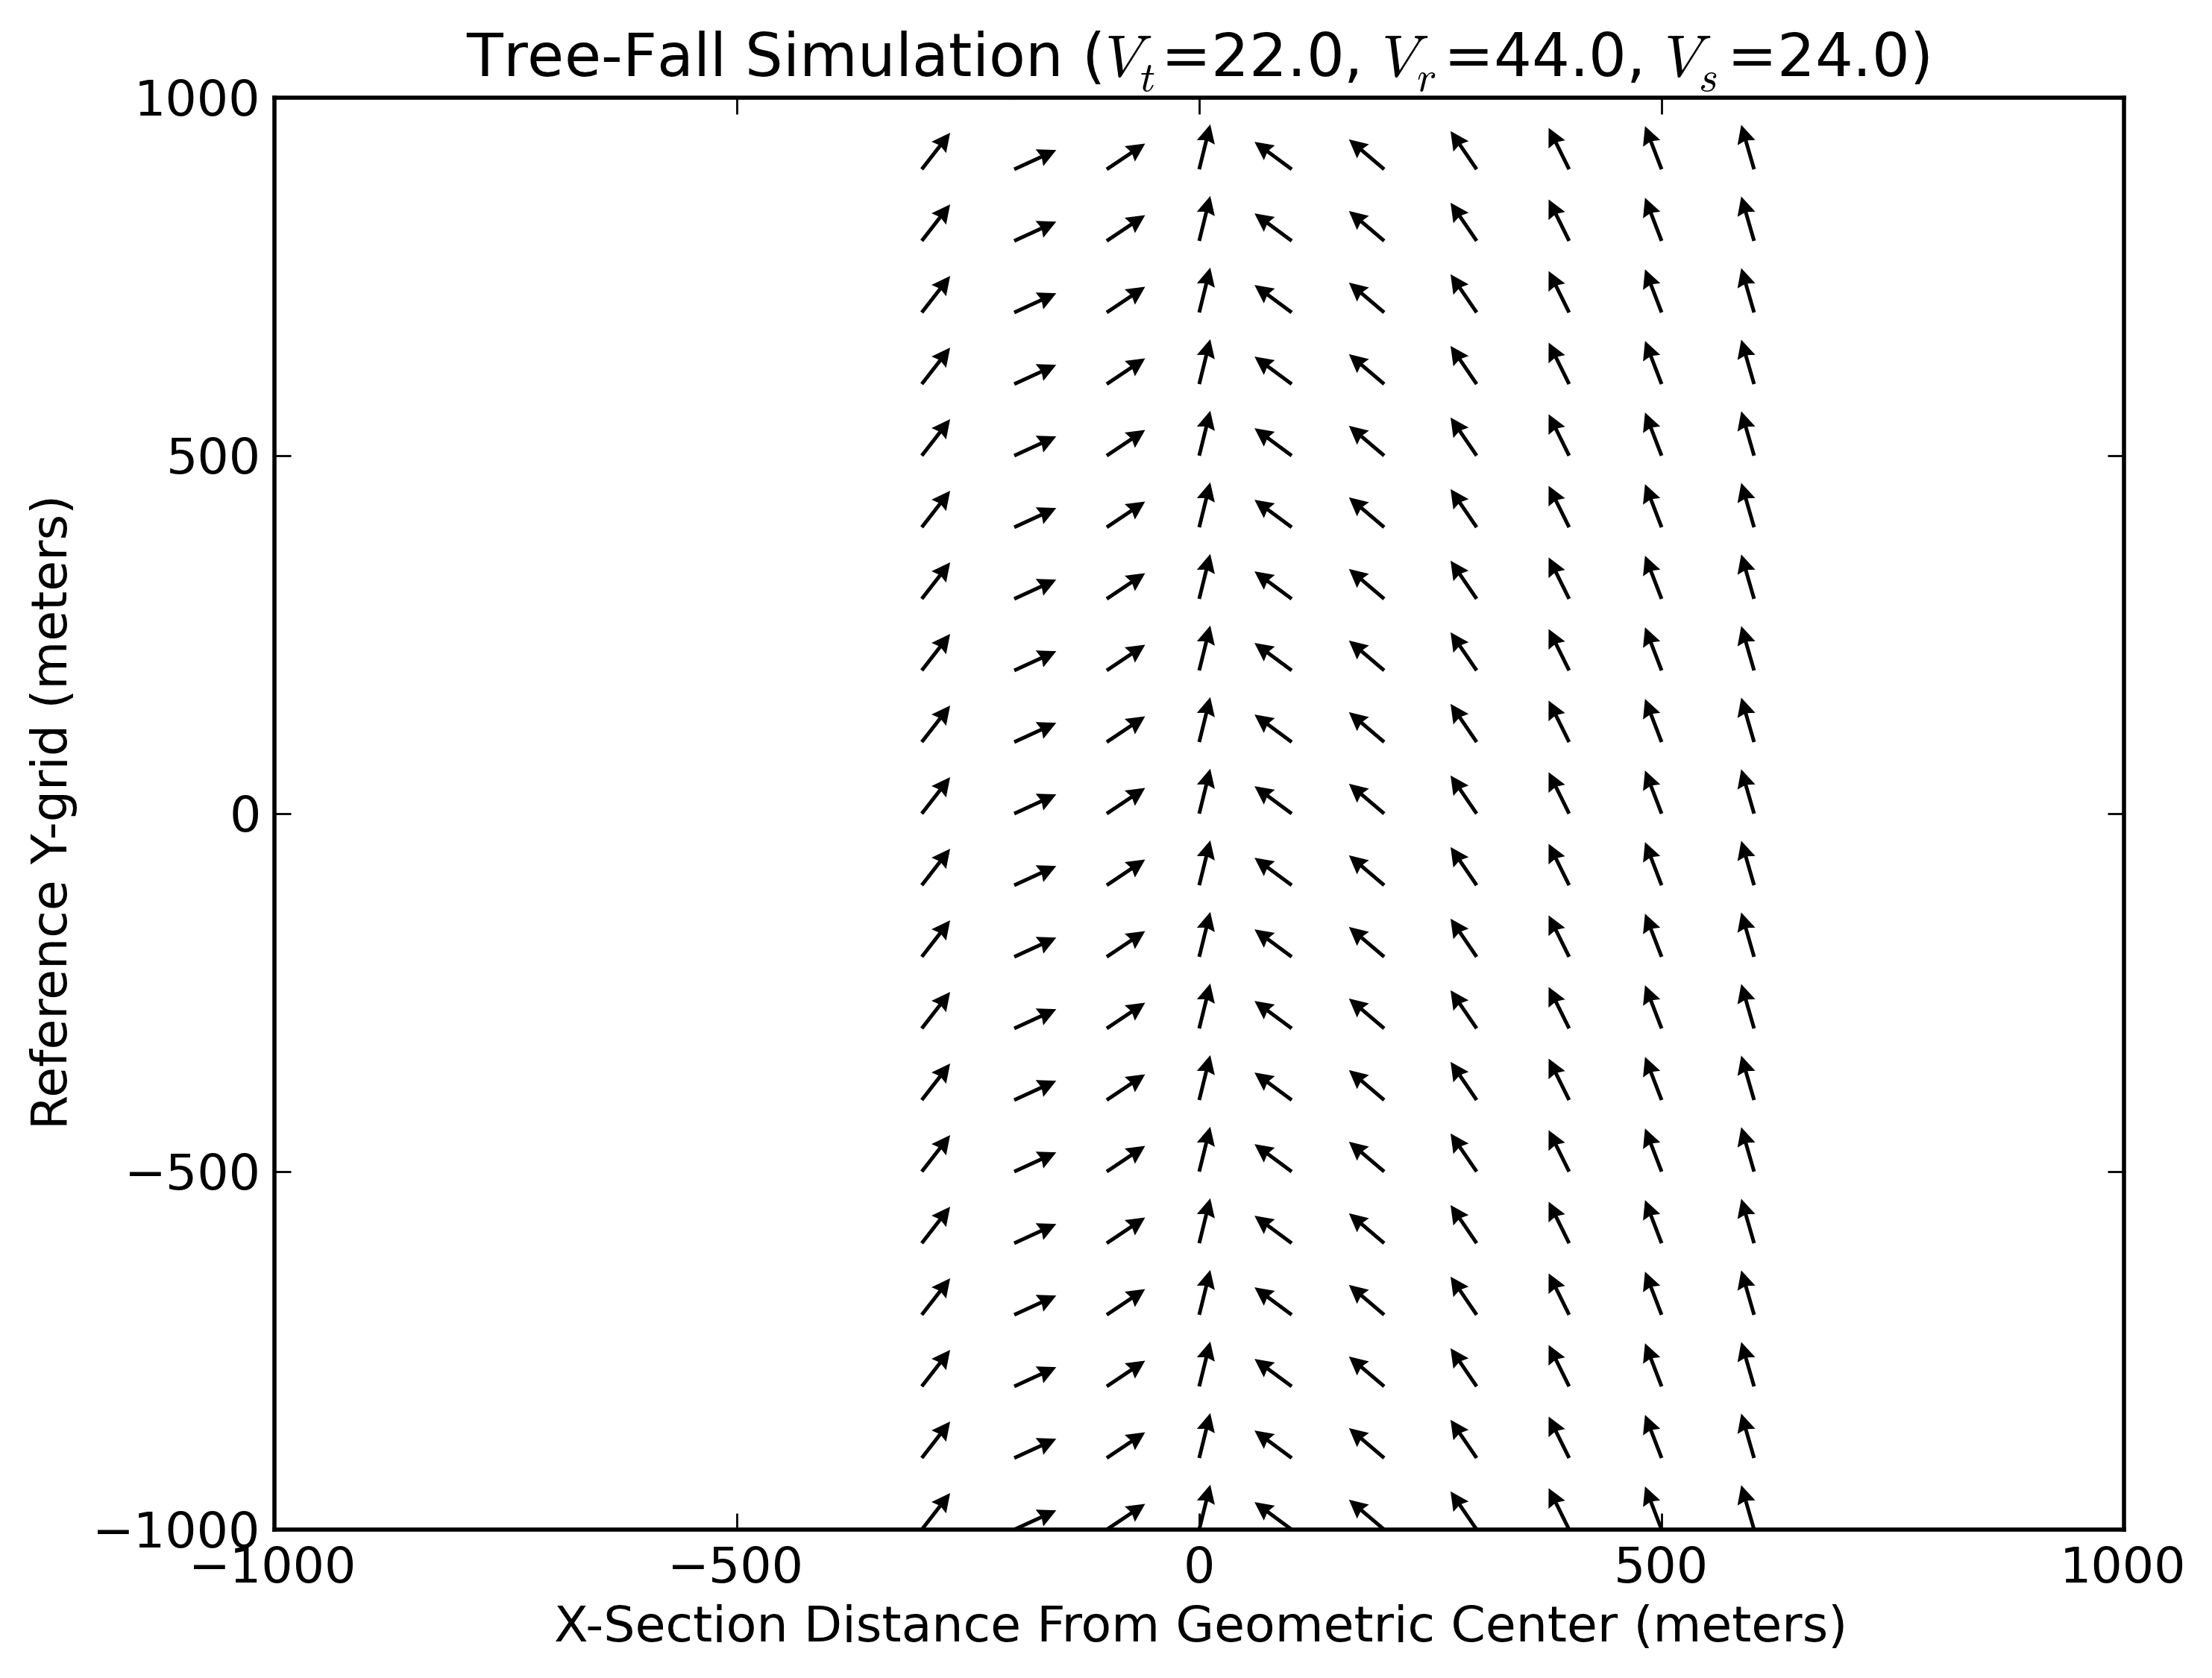
With the observed mean pattern of normalized tree-fall in hand, analytical vortex simulations of idealized tornado-induced tree-fall can be performed until reasonable agreement exists between the observations and the model results. |
|
Model Configuration: Vt: 22 m s-1 Vr: 44 m s-1 Vs: 24 m s-1 |
|
|
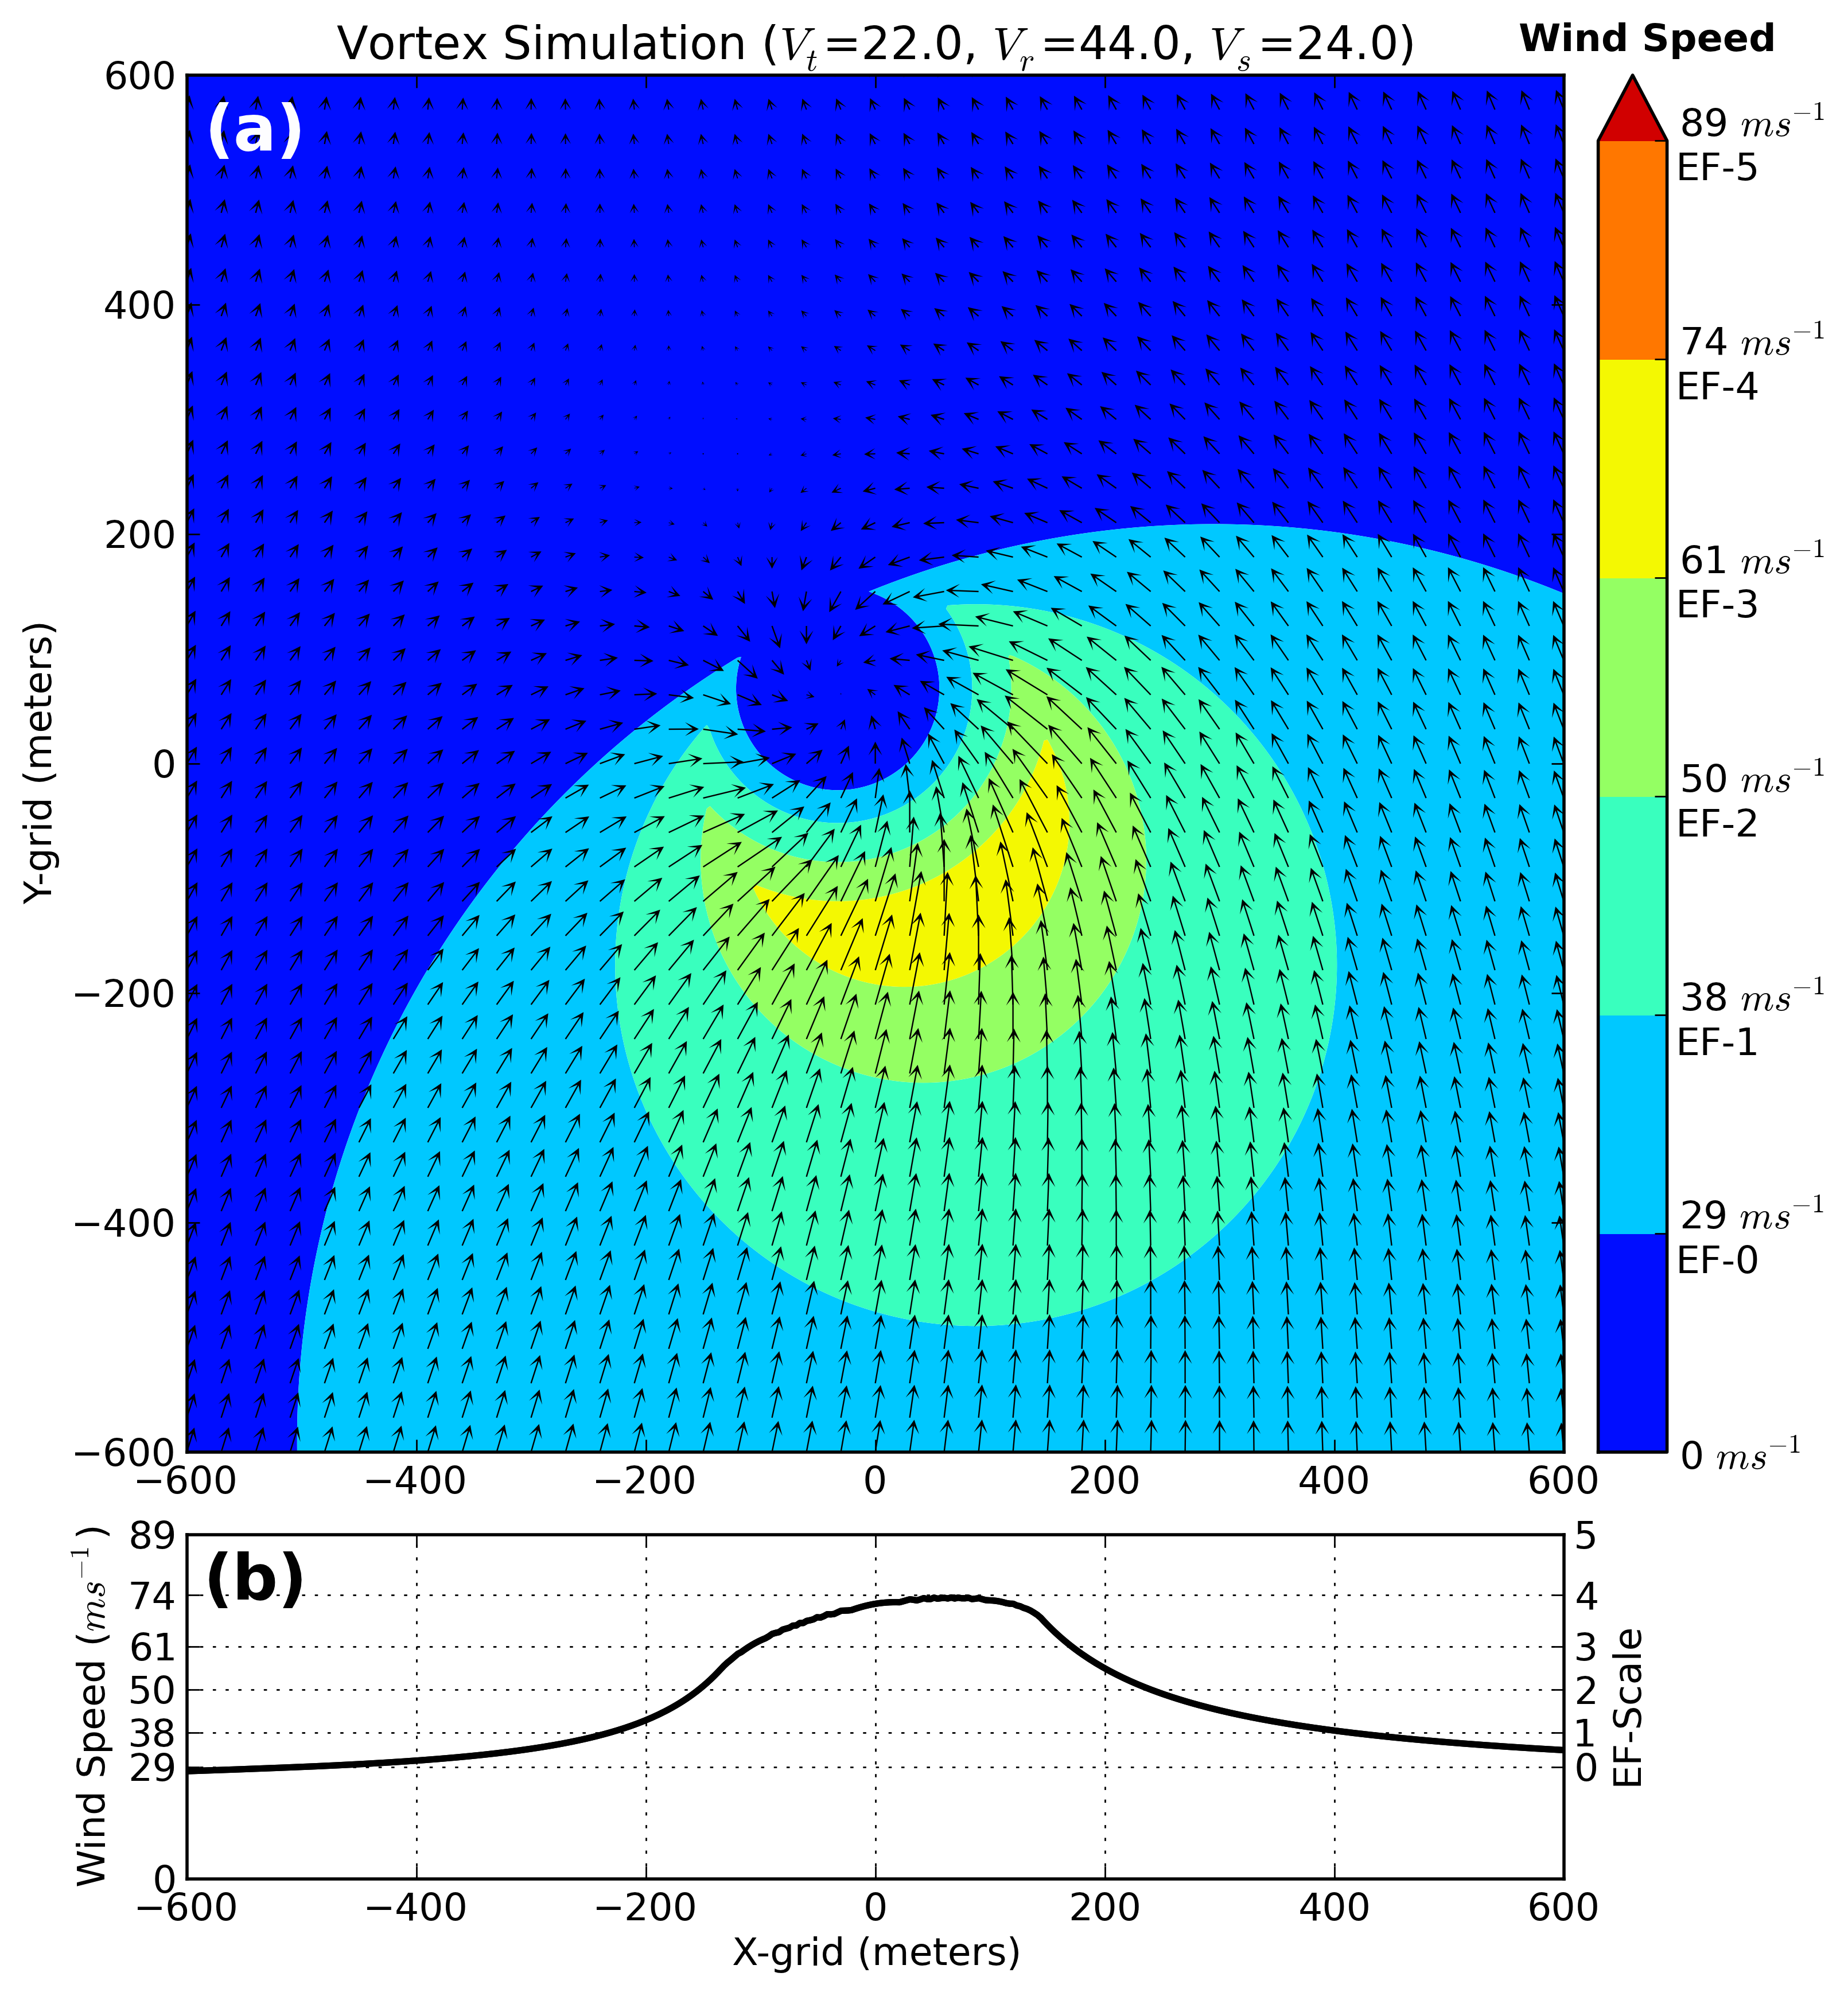
| Figure 6. Simulated pattern of idealized tornado-induced tree-fall. | Figure 7. (a) Wind field corresponding to the tree-fall pattern produced in Fig. 6, and (b) cross-section of maximum along-track wind speeds from panel (a). |
|
The configuration of the model (i.e., ratio of Vt to Vr) above is consistent with simulations performed on other parts of the track. Note the
low ratio of Vt to Vr. The translation speed, Vs, was estimated using KBMX radar data. In this simulation, the maximum wind speed in the domain
was set to 163.5 mph to be consistent with the maximum wind speed estimated using the previous method (~161 mph). The resulting pattern of idealized tornado-induced tree-fall
is shown in Fig. 6 along with the corresponding wind field in Fig. 7. The simulated pattern tree-fall seems to match up pretty well with the mean
normalized observed pattern of tree-fall, particularly in the overall pattern, the orientation of the central convergence line (pointing south to north), and in the radial
extent (-350 m to + 600 m). Differences can be noted near either edge. On the left side, the simulated tree-fall have fall directions from the southwest, while the observations
are more from the west. The southwesterly fall directions in the simulation is due to the fast translation speed (24 m s-1). Likewise, a divergent signature is present
on the right side in the observations and is not present in the simulation. This discrepancy has been noted in other areas of the track and in other studies (Beck and Dotzek 2010).
Karstens et al. 2012 suggest this is the result of a rear-flank downdraft in close proximity to the tornado and is beyond the capability of the analytical vortex model.
The consistency between the two methods (emperical formula and tree-fall analysis) provides some confidence for winds in the mid to high EF-3 range causing the empty railcars to be moved from their orignal location by the tornado. Of course, without detailed measurements we'll never really know, but the methods described here at least provide some sort of estimate. I encourage those with experience in this area to review these findings and provide any comments or feedback they think could contribute to this study. References: Beck, V., N. Dotzek, 2010: Reconstruction of near-surface tornado wind fields from forest damage. J. Appl. Meteor. Climatol., 49, 1517–1537. Karstens, C. D., W. A. Gallus, Jr., B. D. Lee, and C. A. Finley, 2012: Analysis of tornado-induced tree-fall using aerial photography from the Joplin, MO and Tuscaloosa-Birmingham, AL tornadoes of 2011. Submitted to JAMC. Holland, A. P., A. J. Riordan, E. C. Franklin, 2006: A simple model for simulating tornado damage in forests. J. Appl. Meteor. Climatol., 45, 1597–1611. |