
|
|
|
|
|
|
|
|
|
|
|
|
|
|
|
|||||||
|
|
|
|
|
|
|
|
|
||
Updated atmospheric CO2 graphs can be
obtained here.
Related Class Images
Figure
1
- Area coverage, plant carbon and net primary production for major
terrestrial ecosystems. Takle.
Figure
2 -
Area coverage, plant
carbon and net primary production for major terrestrial ecosystems in 1850 and
1980. Takle.
 Figure 3 -
Atmospheric CO2 concentration excess as a function of time.
Adapted from Houghton, J.T.,
G.J. Jenkins, J.J. Ephraums, eds,
1990: 1990 Intergovernment Panel on Climate Change, Cambridge
University Press, 364 pp.
Figure 3 -
Atmospheric CO2 concentration excess as a function of time.
Adapted from Houghton, J.T.,
G.J. Jenkins, J.J. Ephraums, eds,
1990: 1990 Intergovernment Panel on Climate Change, Cambridge
University Press, 364 pp.
 Figure 5 -
Atmospheric changes
in carbon 14
values derived from tree rings between 1820-1954. Source unknown.
Figure 5 -
Atmospheric changes
in carbon 14
values derived from tree rings between 1820-1954. Source unknown.
 Figure 6 -
Annual uptake of Carbon. Adapted and corrected from Sarmiento, J. L.,
1993:
Ocean and carbon cycle. C & EN, May 31
Figure 6 -
Annual uptake of Carbon. Adapted and corrected from Sarmiento, J. L.,
1993:
Ocean and carbon cycle. C & EN, May 31
 Figure 7a -
Anthropogenic CO2
production rate. Adapted from Houghton, J.T., G.J. Jenkins, J.J. Ephraums, eds,
1990: 1990 Intergovernment Panel on Climate Change,
Cambridge University Press, 364 pp.
Figure 7a -
Anthropogenic CO2
production rate. Adapted from Houghton, J.T., G.J. Jenkins, J.J. Ephraums, eds,
1990: 1990 Intergovernment Panel on Climate Change,
Cambridge University Press, 364 pp.
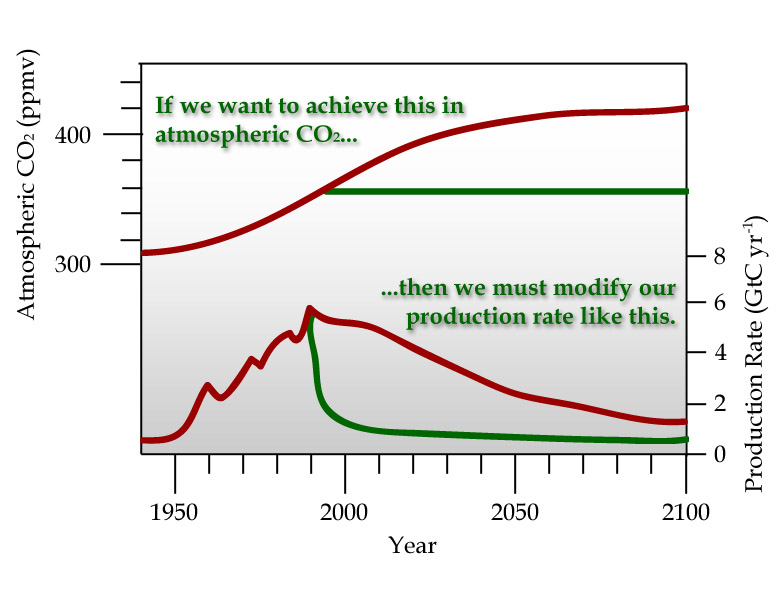 Figure 7b - Modification to
Anthropogenic CO2 production rate. Adapted from Houghton, J.T., G.J. Jenkins, J.J.
Ephraums, eds, 1990: 1990 Intergovernment Panel on Climate Change, Cambridge University
Press, 364 pp.
Figure 7b - Modification to
Anthropogenic CO2 production rate. Adapted from Houghton, J.T., G.J. Jenkins, J.J.
Ephraums, eds, 1990: 1990 Intergovernment Panel on Climate Change, Cambridge University
Press, 364 pp.
 Figure 8 -
Global concentrations of
methane in the troposphere. Adapted from Blake and Rowland (1987).
Figure 8 -
Global concentrations of
methane in the troposphere. Adapted from Blake and Rowland (1987).
 Figure 9 -
Methane, CO2 and
temperature profiles. Adapted from Woodwell et al, Scientific
American, April 1989
Figure 9 -
Methane, CO2 and
temperature profiles. Adapted from Woodwell et al, Scientific
American, April 1989
 Average atmospheric methane
concentrations. Adapted from Khalil and Rasmussen, C and E News,
64 (47), 23.
Figure
10 -
Estimated sources and sinks
of methane. Adapted from the IPCC supplemental Report,
1992.
Average atmospheric methane
concentrations. Adapted from Khalil and Rasmussen, C and E News,
64 (47), 23.
Figure
10 -
Estimated sources and sinks
of methane. Adapted from the IPCC supplemental Report,
1992.
 Figure 11
- Ocean Regulation of Carbon
Figure 11
- Ocean Regulation of Carbon
 Figure 12 -
Trends in domestic animal population (1890-1985). EPA, 1989: Policy options for
stabilizing global climate.
Figure 12 -
Trends in domestic animal population (1890-1985). EPA, 1989: Policy options for
stabilizing global climate.
Figure 13 -
Estimated sources and sinks
of carbon monoxide. EPA, 1989: Policy options for stabilizing global
climate.
 Carbon cycle NASA.
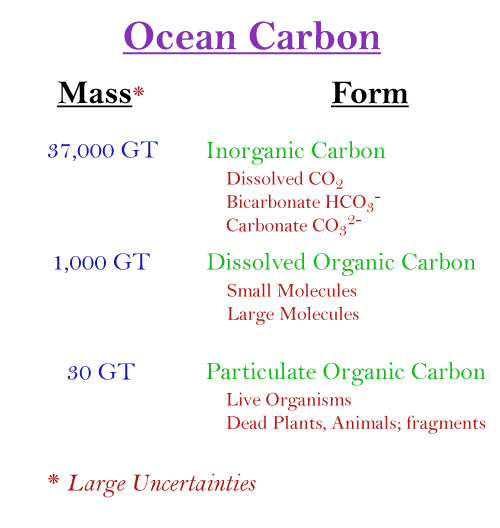 Ocean carbon
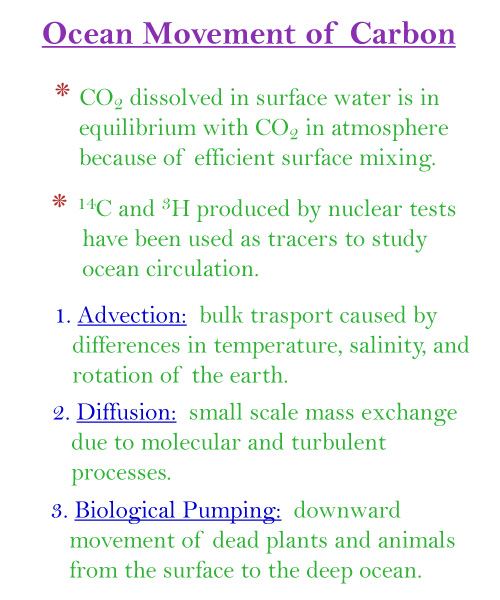 Ocean movement of carbon
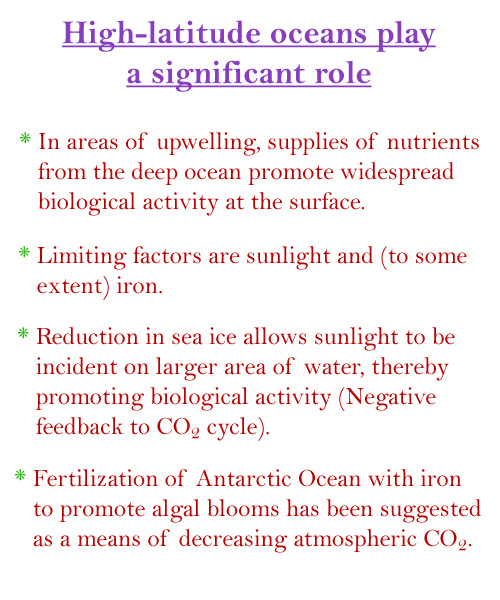 High latitude oceans play a
significant role
High latitude oceans play a
significant role
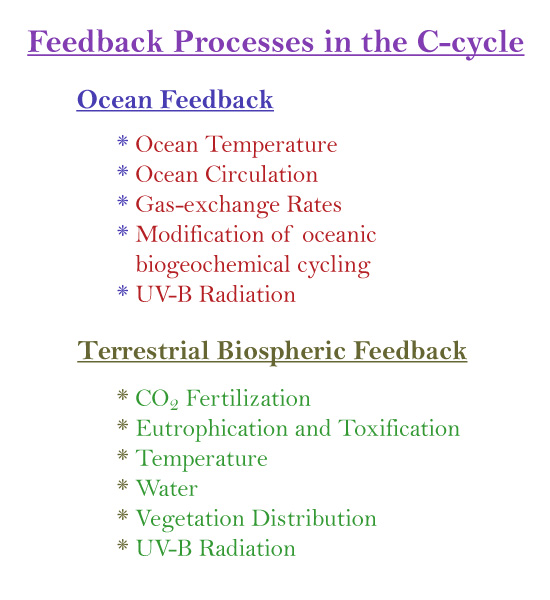 Feedback processes in the
carbon cycle
Feedback processes in the
carbon cycle
 Global concentration of
phytoplankton. NASA.
Global concentration of
phytoplankton. NASA.
 Net assimilation of carbon
by photosynthesis American Scientist July/Aug 1990.
Permission granted by Sigma, Xi, The Scientific Research Society.
Net assimilation of carbon
by photosynthesis American Scientist July/Aug 1990.
Permission granted by Sigma, Xi, The Scientific Research Society.
 Atmospheric changes
in carbon 14
values derived from tree rings between 1820-1954. Source unknown.
Atmospheric changes
in carbon 14
values derived from tree rings between 1820-1954. Source unknown.
 Changes of carbon 13 in tree
rings and of atmospheric CO2 relative to preindustrial conditions
(1800-1850). Source unknown.
Changes of carbon 13 in tree
rings and of atmospheric CO2 relative to preindustrial conditions
(1800-1850). Source unknown.
 Annual uptake of Carbon. Adapted and corrected from Sarmiento, J. L., 1993:
Ocean and carbon cycle. C & EN, May 31
Annual uptake of Carbon. Adapted and corrected from Sarmiento, J. L., 1993:
Ocean and carbon cycle. C & EN, May 31
 Greenhouse effect. (Used with permission from CALMET '95, CAL Working group of SCHOTI.)
 Net Cumulative change in soil Carbon
 Average Annual Live tree C stock change by US county
 MODIS annual NPP averaged over 2000-2005. Courtesy of Steve Running, U. Montana.
 North American Source of CO2