
|
|
|
|
|
|
|
|
|
|
|
|
|
|
|
|||||||
|
|
|
|
|
|
|
|
|
||
© Eugene S. Takle
2000, 2002, 2005
Introduction
We have pointed out in previous units on global climate modeling that very large computers
operating continuously for very long time periods are required to create simulations of the
earth's global climate. As more details of the climate system (e.g., ocean circulation, ocean-
ice dynamics, vegetation, etc.) are included in climate models, this computational burden becomes
even more severe. At the same time, the coarse resolution of global climate models (GCM's) does not allow
them to simulate local climate conditions that impact, say, details of snowfall in mountainous areas
that are important for recharge of reservoirs, or climate variations in the US Great Lakes region,
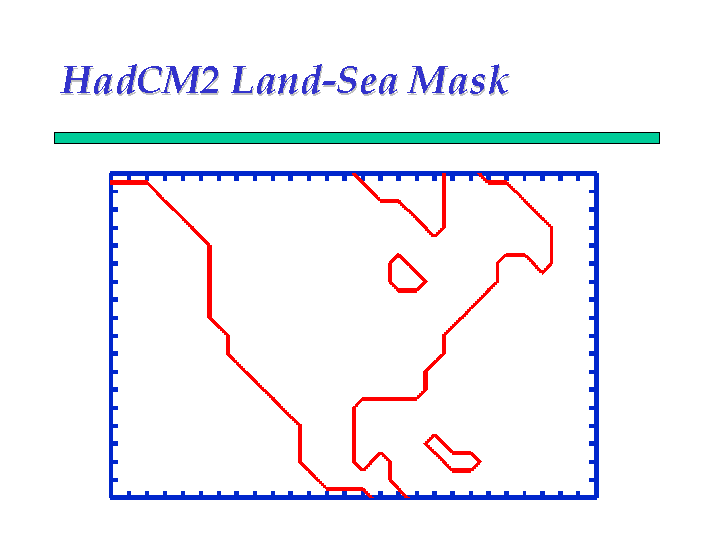
or the climate of coastal regions. In fact, global models at low resolution do not even include
the state of Florida on the North American landmass (see the outline of North America in a previous
graph).
Regional Climate Modeling
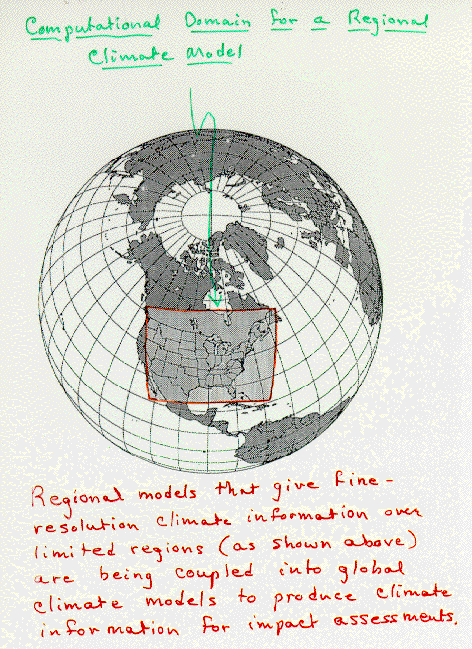
An alternative to global modeling is regional climate modeling. As the name implies, a regional
climate model (RCM) does not attempt to simulate the entire globe but only a portion thereof,
Figure 2.
Regional models use the same laws of physics described in terms of mathematical equations as do global
models. Regional models have their advantages and disadvantages. On the plus side, regional models
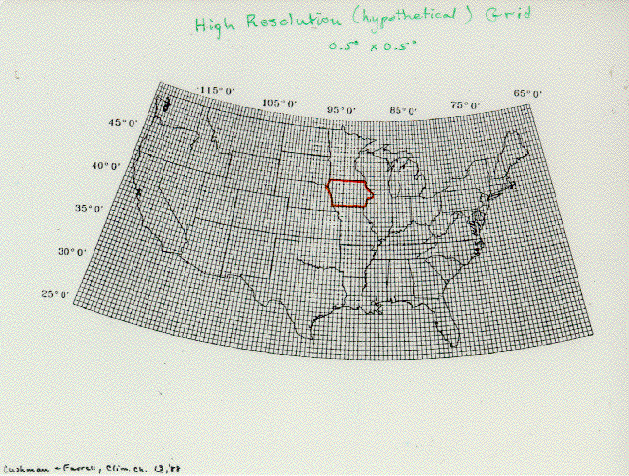
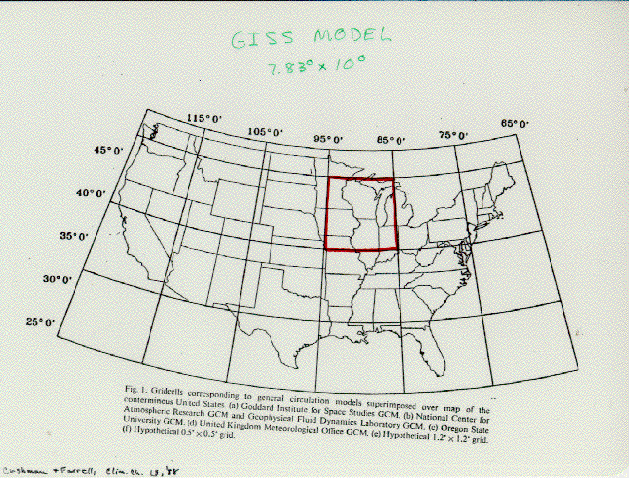
cover smaller areas so they can have higher spatial resolution,
Figure 3, for the same number of
grid points as a global model, Figure 4.
This allows better resolution of mountainous (Figure 5)
and coastal areas (Figure 1), for instance, where
a distance of 50 km can mean a dramatic change in climate. It also means that smaller-scale weather
systems, particularly the kind of weather systems in mid-continent areas like Iowa experience in
the summertime are better resolved. These systems can produce intense rainfall in one county and leave the adjacent
county with a mere trace. Global models having only one grid point to represent the entire state
of Iowa certainly are not able to capture this spatial variability.
On the negative side, regional models, because they do not span the entire globe, must rely on information provided at the lateral boundaries in order to simulate climates for the interior of their model domains, Figure 2. Therefore, regional models seeking to simulate future climates for a particular geographic region, must rely on global climate models, presumably run at coarse resolution, to give them the lateral boundary conditions at regular (say 6-hour) intervals so that the regional model can create the details of regional climate in its domain. So regional models don't replace global models but might be able to supply added value to simulations done with global models.
PIRCS
A question that arises is "how good are regional models at reproducing climate features of
the past?" The Project to Intercompare Regional Climate Simulations
(PIRCS)
consists of a series of experiments where modeling groups around the world are performing exactly
the same simulations for intercomparison to evaluate capabilities of models to simulate details
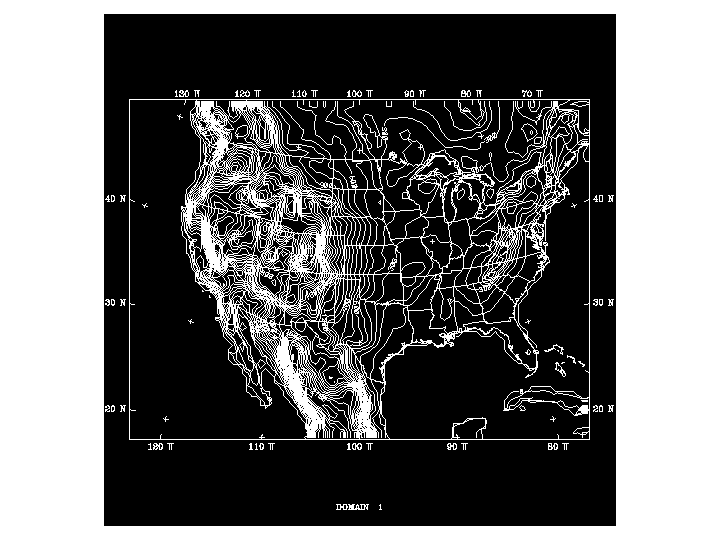
of regional climate. The RCM vs. GCM domain (Figure 6)
shows the relationship between regional climate model
grid points (blue over water and green over land) and global climate model
grid points (red). In the PIRCS experiments, the global model gives
information at 6-hour intervals only along the outside frame. The regional
model then uses this information to calculate the pressure, wind,
temperature, humidity, precipitation, etc at each RCM grid point on the
surface and about 16 levels in the vertical at 3-minute intervals until
it gets more information from the global model 6 hours later.
The first experiment conducted under this project was a simulation of a short period (60 days) during the 1988 drought, Figure 7, in the central US (15 May - 15 July 1988). This period of minimal precipitation was chosen so that model response to radiative forcing could be examined with minimal complication by clouds and moist soil. Eight models participated in this intercomparison.
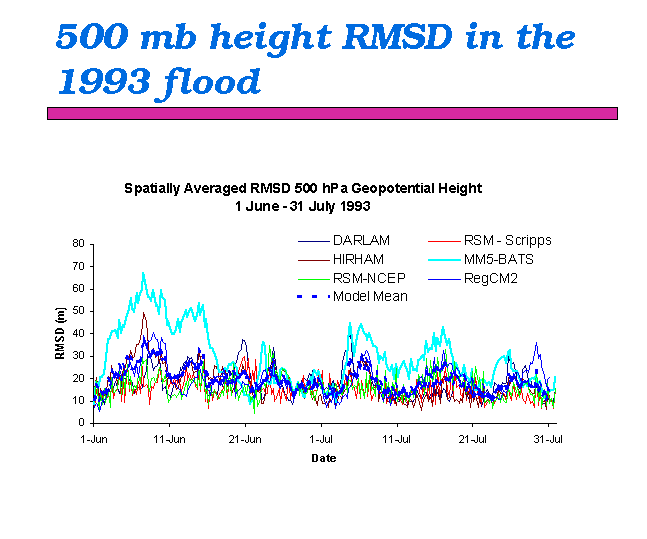
The root-mean-square difference from observations of the 500 mb flow, Figure 8, for each model gives an overview of how well each model simulates the large-scale flow. As we saw with results of global models, there are some models that are superior for certain periods but all cluster around a departure (error) of about 20-30 mb. Although the spatial patterns (figure not shown) of large-scale flow differ for different models, results generally show largest errors to be toward the middle of the domain. Evidently, models create larger errors at locations near the center of the domain where the model has maximum freedom and smallest errors near the constraining boundaries where conditions are specified.
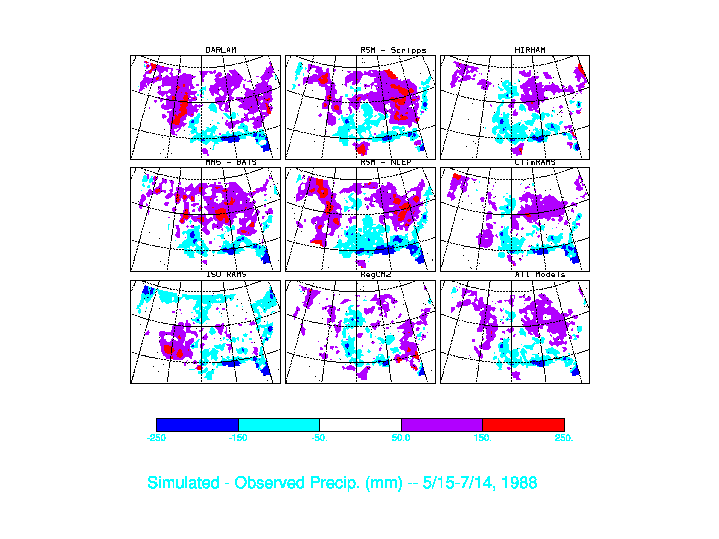
Figure 9 shows how each model simulates total precipitation by giving the error (difference between simulated and observed) over the 60-day period. The composite of all 8 models given in lower right shows that the aggregate of all model results has relatively low error. Most models have too much precipitation in the northern part of the domain and not enough in the southern US.
The day-by-day precipitation amounts for the upper Mississippi River Basin on are shown in Figure 10. The actual observed amount is shown by the heavy black line. Note that for days 136-164 and 178-196 precipitation occurred in discrete events usually separated by dry periods. By contrast, the period 165-177 was a period of day-after-day weak precipitation events. Generally the models capture the occurrence of events during periods when rain comes in discrete episodes. Models generally produce too much rain in the period 165-177. However the overall ability of the models to produce an aggregate of total precipitation is quite good. A plot of accumulating precipitation totals shows most models to be producing too much rain during the period.
The next plot shows model values of incident solar radiation at a point in Kansas where measurements were being taken during this period in summer 1988. With exception of a couple of models, most simulations give the appropriate amount of shortwave energy.
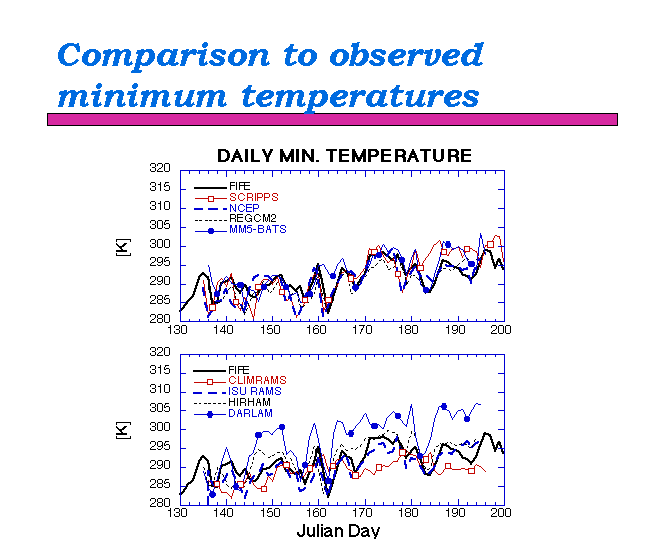
Plots of daily maximum temperature, Figure 11, and daily minimum temperature, Figure 12, reveal differences in model capabilities in representing day-to-day changes. Some models evidently are quite good at capturing occurrences of warm and cool days. Comparing this graph with the graph for daily minimum temperature shows that minimum temperature is simulated somewhat better than daily maximum.
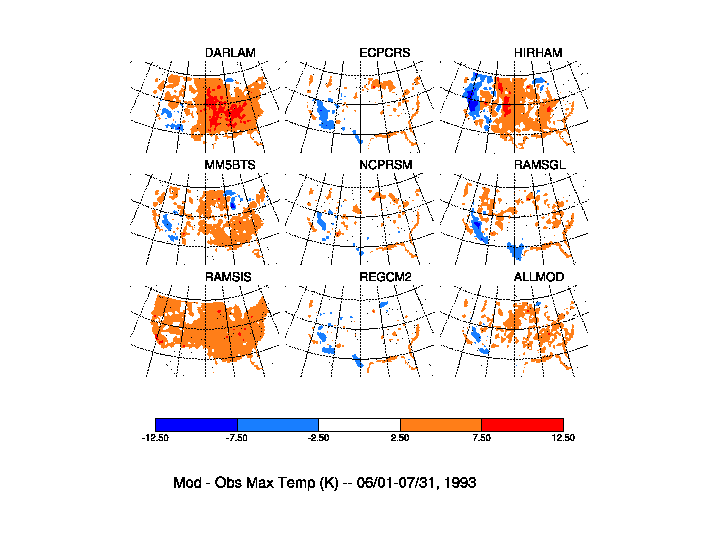
Previous plots gave temperatures for a particular point whereas the next two plots give model error for daily maximum and minimum temperature at all locations across the US for the month of June 1988. For maximum temperature (Figure 13) it is interesting to see that, while some models (e.g., DARLAM) seem uniformly too warm and other models (e.g., ISU Rams) are too cool, the aggregate of all 8 models (ALLMOD) gives results that are quite close to observations. For daily minimum temperature (Figure 14), by contrast, some individual models give results closer to observations than the aggregate of all models.
Extreme Weather Events
and Regional Models
Extreme weather events have the most impact on human health and safety and on the economy.
The next series of plots show that capabilities of a regional climate model to simulate a flood event.
The summer of 1993 was a notable period in the Midwest US due to the occurrence of some of the most serious
flooding of the 20th century. Zaitao Pan, in his PhD dissertation at Iowa State University, used a
regional climate model to simulate individual events during this flood period. Measured
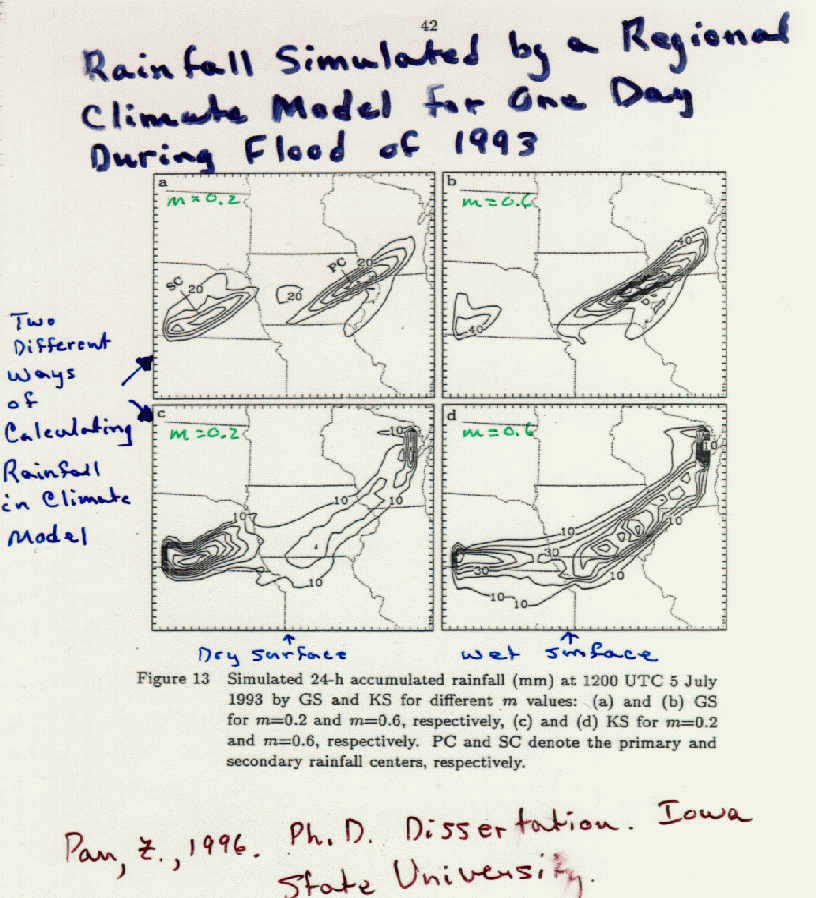
accumulated rainfall for the 24-hour period ending 1200 UTC 5 July 1993, Figure 15, shows a region of heavy
precipitation in Iowa and adjacent states with a primary center (labeled PC) and a secondary center
(SC). Maximum precipitation in the PC was about 115 mm (over 4 inches) with a secondary maximum
of over 2 inches at the SC.
Model results using two different options for representing rainfall processes, Figure 16, show that different options have significant influence on simulated precipitation. The combination of model parameters used for plot (a) seems to give results most closely resembling the measurements, Figure 15. This option gave two centers, with PC having a maximum precipitation amount of 120 mm and a secondary center with maximum of 80 mm. The simulated SC is too far west and the PC is too far east, but the precipitation footprints are quite close to the observed.
In part (b), Figure 16, the soil moisture in the model was assumed wet as compared to an assumption of dry soil for Figure 12(a). The result is that PC has more precipitation and SC has less. Evidently, the influence of soil moisture is complicated and may either increase or decrease resulting precipitation.
Figures c and d, Figure 16, give results of a different model option for dry and wet soil, respectively. Dual centers are simulated with this option also, but resemblance to observations is poorer than simulations a/b.
A second event (9 July 1993) during the flood year also has two precipitation maxima in the 24-hour accumulation, Figure 17. The model results for this event also revealed two centers as observed. Amounts and exact location show differences from observations.
An additional simulation, Figure 18, for 9 July with several different soil moisture values reveals that as surface moisture increases, more rain is produced in the primary center and less in the secondary center. A more detailed analysis of upper-air conditions revealed that the primary center had sufficient instability at upper levels and only needed more moisture (which was supplied by a more moist surface) to produce more rain. By contrast, the additional surface moisture produced less, not more, precipitation at SC. The reason for this was that the SC needed more surface heat to stimulate convection to enhance rainfall. But a more moist surface did the opposite: it cooled the surface and actually suppressed rainfall.
Land Use Changes
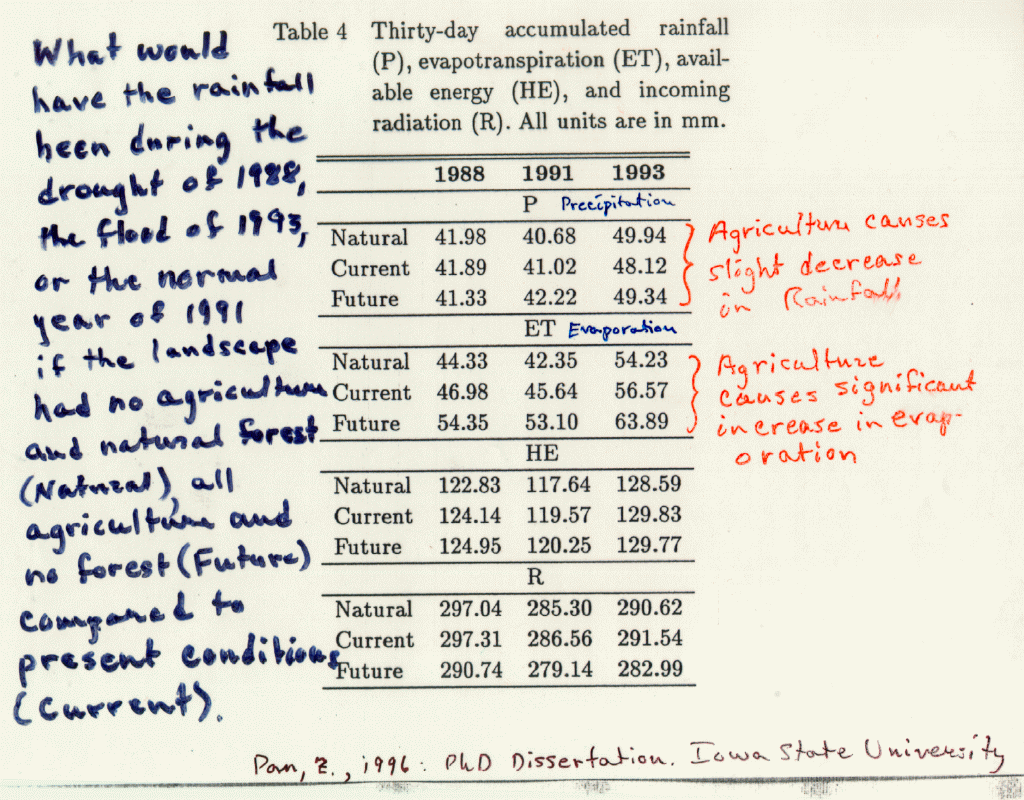
In a final analysis, we show results of a simulation, Figure 19,
over the whole US to examine the influence of land use changes since the European settlement of the US.
In this experiment we use observed meteorological conditions for a normal year, a flood year ,
and a drought year, and compare results from simulations using three different
assumed land use patterns:
For simulation of flood-year precipitation over the US for both current and full-crop landuse increased precipitation by about 2%, although precipitation over the flood area decreased somewhat for both present and full-crop land use. For the drought year, land use seemed to have very little effect.