
|
|
|
|
|
|
|
|
|
|
|
|
|
|
 |
|||||||
|
|
|
|
|
|
|
|
|
||
 Figure 1 - Major ocean currents.
 Figure 2 - Gulf stream temperature. NASA.
 Figure 4 - Idealized relation of the polar front to the wind and pressure belts of the world
 Figure 5
- The
Great Ocean Conveyor Belt (From IPCC, 2001)
 Figure 6 - Schematic flow lines for abysal circulation Adapted
from Stommel, H., Deep Sea Research 1958.
 Figure 8 - Strait of Gibraltar
 Figure 9 - Average Annual Precipitation -Tropical Pacific Ocean
 Figure 10 - Schematic Temperature Distributions
 Figure 11 - Slope of Sea Surface
 Figure 12 - Essential nutrients for ocean
plants
.
 Figure 13 -
Euphotic and Aphotic Zones.
 Figure 14 - Biological activity in the
oceans of the northern hemisphere American Scientist
July/Aug 1990. Permission granted by Sigma, Xi, The Scientific Research
Society.
 Figure 15 - Biological activity in the
oceans of the southern hemisphere American Scientist July/Aug 1990.
Permission granted by Sigma, Xi, The Scientific Research Society.
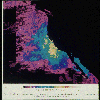 Figure 16 -
Mean near-surface phytoplankton pigment concentrations. NASA.
 Figure 18 - TOGA In Situ Ocean Observing System
Related Class Images
 Sea-surface temperatures for
September 1994.
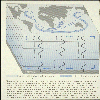 Flows of carbon in the world's oceans.
American Scientist, 78, 316 (1990).
Permission granted by Sigma Xi,The Scientific Research Society.
 Southern ocean circulation. Natural History, Mar
,1990.
 Projected temperature changes
after gradual CO2 increase. Natural History, Mar
,1990.
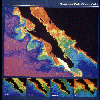 Seasonal Baja ocean color. NASA.
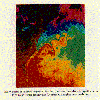 Example of sea surface
temperature... NASA.
 Global concentration of
phytoplankton. NASA.