|
|
|
|
|
|
|
|
|
|
|
|
|
|
 |
|||||||
|
|
|
|
|
|
|
|
|
||
Updated atmospheric CO2 graphs can be obtained here
Related Class Images
 Figure
1 - American Scientist, 78, 325. Permission granted by Sigma, Xi, The Scientific Research Society.)
 Figure 2 - (Adapted from Khalil and Rasmussen, C and E News, 64 (47), 23.)
 Figure 3 -
Changes in mean global surface temperature from the 1951-1980 average from 1880-1994. (U.S. Global Change
Research Program.)
 Figure 4 -
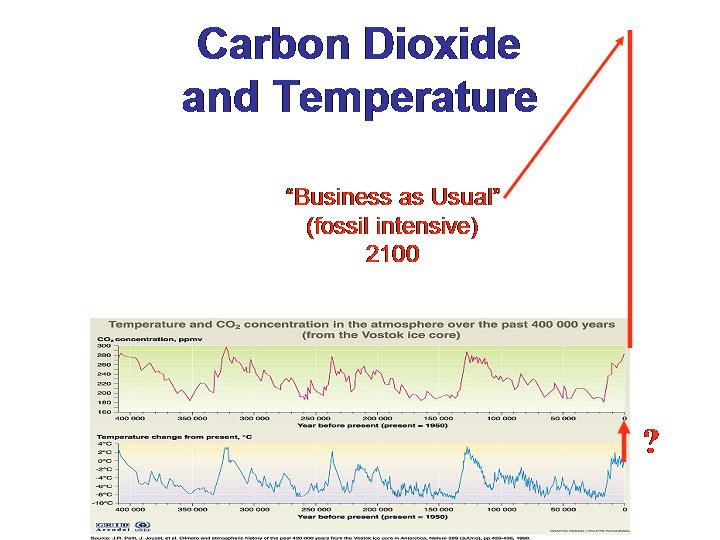
Temperature and CO2 concentration in the atmosphere over the past 400,000
years. (U.N. Environmental Programme/GRID-Arendal)
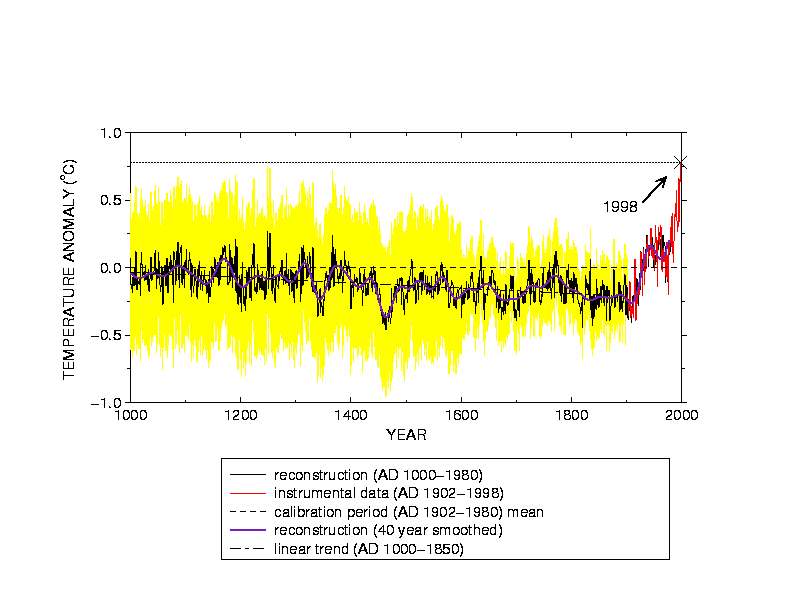
 Figure 5 - Temperature Anomaly
 Figure 6 - Carbon Dioxide and Temperature up to 2005
 Figure 7 - Carbon Dioxide and Temperature up to 2100 (Business as Usual Scenario)