
|
|
|
|
|
|
|
|
|
|
|
|
|
|
|
|||||||
|
|
|
|
|
|
|
|
|
||
 Figure 1 -
Causes of relative sea-level change. Earthquest, UCAR.
Figure 1 -
Causes of relative sea-level change. Earthquest, UCAR.
 Figure 2 -
Global mean sea-level rise over the last century. IPCC, 1990.
Figure 2 -
Global mean sea-level rise over the last century. IPCC, 1990.
 Figure 3 -
Variations of some selected glaciers as measured by their length. IPCC, 1990.
Figure 3 -
Variations of some selected glaciers as measured by their length. IPCC, 1990.
 Figure 4 -
A boulder at the western margin of the Quelccaya Ice Cap in the tropical
Andes of Peru in 1978. Chemical & Engineering News, November 27, 1995
Figure 4 -
A boulder at the western margin of the Quelccaya Ice Cap in the tropical
Andes of Peru in 1978. Chemical & Engineering News, November 27, 1995
 Figure 5 -
The same boulder in 1995. Chemical & Engineering News, November 27, 1995
Figure 5 -
The same boulder in 1995. Chemical & Engineering News, November 27, 1995
 Figure 6 -
Physical characteristics of glacier ice on earth. Adapted from IPCC, 1990.
Figure 6 -
Physical characteristics of glacier ice on earth. Adapted from IPCC, 1990.
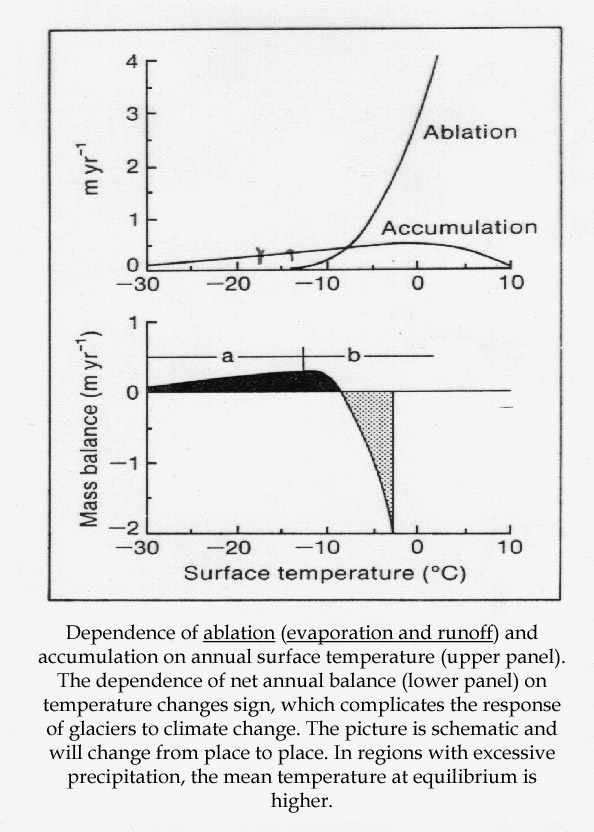 Figure 7 -
Dependence of ablation and accumulations on annual surface temperature. IPCC, 1990.
Figure 7 -
Dependence of ablation and accumulations on annual surface temperature. IPCC, 1990.
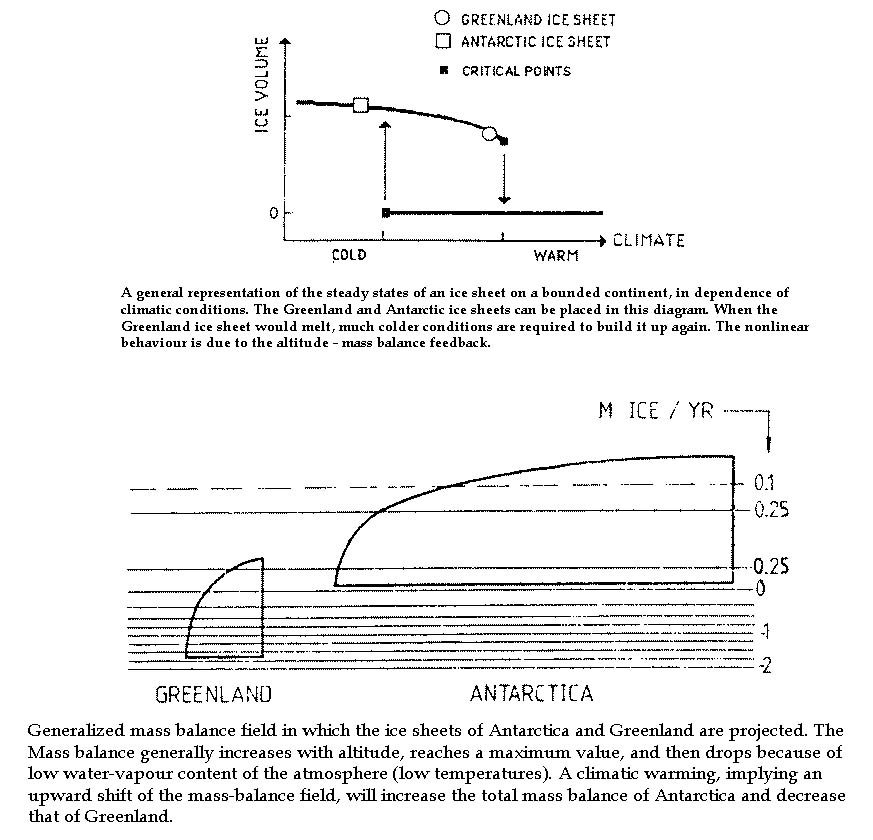 Figure 8 -
Generalized mass balance field in which the ice sheets of Antarctica and Greenland are projected.
Figure 8 -
Generalized mass balance field in which the ice sheets of Antarctica and Greenland are projected.
 Figure
9 - Overview.
Figure
9 - Overview.
 Figure 10 -
Antarctic Ice. Earthquest, UCAR.
Figure 10 -
Antarctic Ice. Earthquest, UCAR.
 Figure 11 -
Processes affecting the stability of the West Antarctic Ice Sheet.
Figure 11 -
Processes affecting the stability of the West Antarctic Ice Sheet.
 Figure 12 -
Latent heat and, coastal polynya.
Figure 12 -
Latent heat and, coastal polynya.
 Figure 13 - Large scale meridional circulation of the ocean.
 Figure 14 -
Annual mass balance of Greenland Ice Sheet.
Figure 14 -
Annual mass balance of Greenland Ice Sheet.
 Figure 15 - Predicted sea-level rise according to various IPCC emissions scenarios.
 Figure 16 - Temperature scenario used in present estimate of sea-level changes.
 Figure 17 -
Global sea-level rise for scenarios B, C, and D and for "business-as-usual". IPCC, 1990.
Figure 17 -
Global sea-level rise for scenarios B, C, and D and for "business-as-usual". IPCC, 1990.
 Figure 18 -
Major delta areas vulnerable to sea-level rise.
Figure 18 -
Major delta areas vulnerable to sea-level rise.
Related Class Images
Glacier Pictures From Ohio State University.
 Overview.
 Overview.
 Retreat of some mountain glaciers measured by distance up the valley.