
|
|
|
|
|
|
|
|
|
|
|
|
|
|
|
|||||||
|
|
|
|
|
|
|
|
|
||
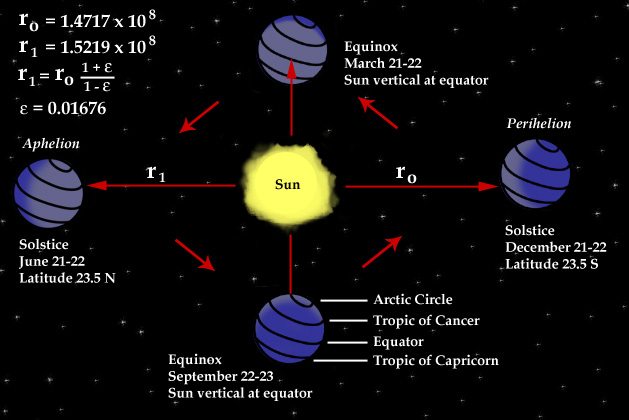 Figure 1 - Earth at aphelion and perihelion Adapted from Lutgens, F.K., and Tarbuck E. J., The Atmosphere: An Introduction to Meteorology, 1986, Reprinted by permission of Prentice Hall, Upper Saddle
River, N. J., 07458.
Figure 1 - Earth at aphelion and perihelion Adapted from Lutgens, F.K., and Tarbuck E. J., The Atmosphere: An Introduction to Meteorology, 1986, Reprinted by permission of Prentice Hall, Upper Saddle
River, N. J., 07458.
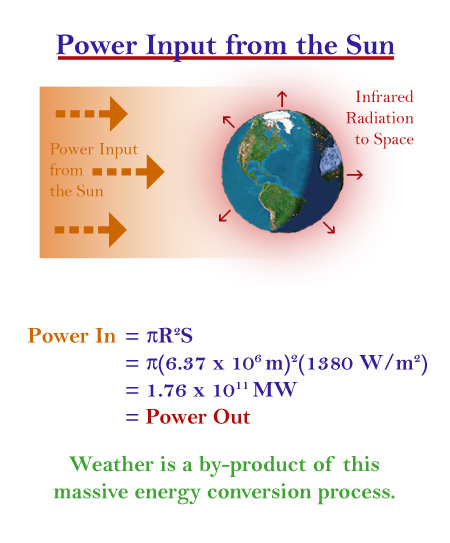 Figure 2
- Power input from
the Sun.
Figure 2
- Power input from
the Sun.
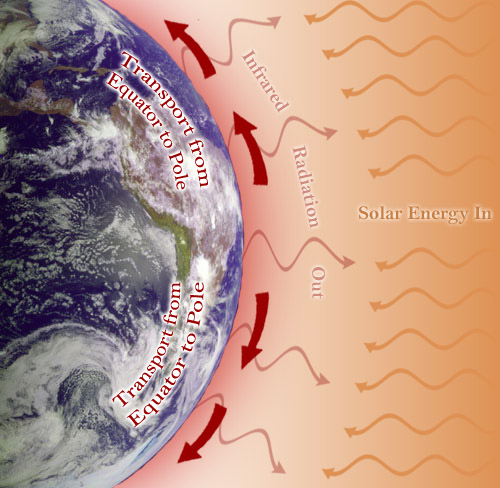 Figure 3
- Transport
and radiation.
Figure 3
- Transport
and radiation.
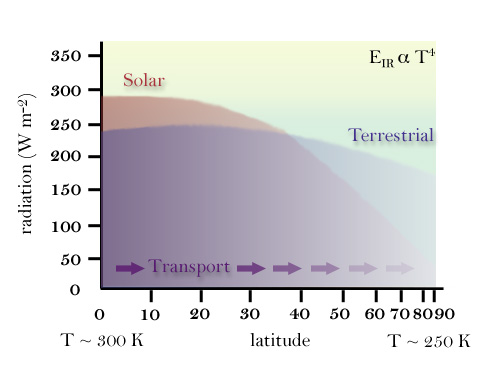 Figure 4
-
Radiation flux vs. Latitude.
Figure 4
-
Radiation flux vs. Latitude.
 Figure 5 - World mean sea-level
temperatures in winter. (After Howard J. Critchfield, General
Climatology, 3rd ed., 1974 by Prentice-Hall, Inc.)
Figure 5 - World mean sea-level
temperatures in winter. (After Howard J. Critchfield, General
Climatology, 3rd ed., 1974 by Prentice-Hall, Inc.)
 . Figure 6 - World mean sea-level
temperatures in summer. (After Howard J. Critchfield, General
Climatology, 3rd ed., 1974 by Prentice-Hall, Inc.)
. Figure 6 - World mean sea-level
temperatures in summer. (After Howard J. Critchfield, General
Climatology, 3rd ed., 1974 by Prentice-Hall, Inc.)
 Figure 7 -
Structure and temperature of the Atmosphere.
Figure 7 -
Structure and temperature of the Atmosphere.
 Cyclic changes that occur in
the upper-level airflow of the westerlies. Lutgens, F.K., and Tarbuck E. J., The Atmosphere:
An Introduction to Meteorology, 1986, Reprinted by permission of Prentice Hall, Upper Saddle
River, N. J., 07458.
Cyclic changes that occur in
the upper-level airflow of the westerlies. Lutgens, F.K., and Tarbuck E. J., The Atmosphere:
An Introduction to Meteorology, 1986, Reprinted by permission of Prentice Hall, Upper Saddle
River, N. J., 07458.
 Figure 8 - Global circulation on a
nonrotating earth. Lutgens, F.K., and Tarbuck E. J., The Atmosphere:
An Introduction to Meteorology, 1986, Reprinted by permission of Prentice Hall, Upper Saddle
River, N. J., 07458.
Figure 8 - Global circulation on a
nonrotating earth. Lutgens, F.K., and Tarbuck E. J., The Atmosphere:
An Introduction to Meteorology, 1986, Reprinted by permission of Prentice Hall, Upper Saddle
River, N. J., 07458.
 Figure 9 - Wind and pressure belts of
the earth. Lutgens, F.K., and Tarbuck E. J., The Atmosphere:
An Introduction to Meteorology, 1986, Reprinted by permission of Prentice Hall, Upper Saddle
River, N. J., 07458.
Figure 9 - Wind and pressure belts of
the earth. Lutgens, F.K., and Tarbuck E. J., The Atmosphere:
An Introduction to Meteorology, 1986, Reprinted by permission of Prentice Hall, Upper Saddle
River, N. J., 07458.
Figure 10 - Vegetation Index for July
 Figure 11 - Idealized relation of the
polar front to the wind and pressure belts of the world. Donn, W.
L., 1975: Meteorology. McGraw-Hill, Inc., New York, NY. 518 pp.
Figure 11 - Idealized relation of the
polar front to the wind and pressure belts of the world. Donn, W.
L., 1975: Meteorology. McGraw-Hill, Inc., New York, NY. 518 pp.
 Figure 12 - Idealized diagram showing
the relationship between wind speed aloft and air flow in the middle and
lower troposphere. Lutgens, F.K., and Tarbuck E. J., The Atmosphere:
An Introduction to Meteorology, 1986, Reprinted by permission of Prentice Hall, Upper Saddle
River, N. J., 07458.
Figure 12 - Idealized diagram showing
the relationship between wind speed aloft and air flow in the middle and
lower troposphere. Lutgens, F.K., and Tarbuck E. J., The Atmosphere:
An Introduction to Meteorology, 1986, Reprinted by permission of Prentice Hall, Upper Saddle
River, N. J., 07458.
 Figure 13 - Distribution of average
annual precipitation over the continents. Trewartha, G. T., 1968: An
Introduction to Climate. McGraw-Hill, Inc. New York, NY, 408 pp.
Figure 13 - Distribution of average
annual precipitation over the continents. Trewartha, G. T., 1968: An
Introduction to Climate. McGraw-Hill, Inc. New York, NY, 408 pp.
 Figure 14 - Distribution of types of
climate over the continents. Trewartha, G. T., 1968: An
Introduction to Climate. McGraw-Hill, Inc. New York, NY, 408 pp.
Figure 14 - Distribution of types of
climate over the continents. Trewartha, G. T., 1968: An
Introduction to Climate. McGraw-Hill, Inc. New York, NY, 408 pp.
 Figure 15 - Average annual
precipitation over the tropical Pacific Ocean. (Adapted from R. C.
Taylor, 1973:
An Atlas of Pacific Islands Rainfall, Hawaii Institute of
Geophysics, 1973)
Figure 15 - Average annual
precipitation over the tropical Pacific Ocean. (Adapted from R. C.
Taylor, 1973:
An Atlas of Pacific Islands Rainfall, Hawaii Institute of
Geophysics, 1973)
 Figure 16 - Nocturnal summertime
precipitation in the U.S. midwest.
Figure 16 - Nocturnal summertime
precipitation in the U.S. midwest.
Related Class Images
 Hadley cells in relation
to wind and pressure belts.
Hadley cells in relation
to wind and pressure belts.
 Schematic description of a
typical cell of an air-mass thunderstorm in three stages of its life
cycle. Wallace, J. M. , and Hobbs, P. V., 1977: Adapted from The
Thunderstorm, U.S. Government Printing Office, 1949.
467 pp.
Schematic description of a
typical cell of an air-mass thunderstorm in three stages of its life
cycle. Wallace, J. M. , and Hobbs, P. V., 1977: Adapted from The
Thunderstorm, U.S. Government Printing Office, 1949.
467 pp.
 Diurnal percentages of
total rainfall for eastern and western Iowa. Taylor, ISU Masters Thesis
Diurnal percentages of
total rainfall for eastern and western Iowa. Taylor, ISU Masters Thesis
 First harmonic time of
maximum frequency for events greater than or equal to 2.54 mm/h. Adapted from Balling, R. C.,
Jr., 1985. J. Climate Appl. Meteor., 24, 1383-1387.
First harmonic time of
maximum frequency for events greater than or equal to 2.54 mm/h. Adapted from Balling, R. C.,
Jr., 1985. J. Climate Appl. Meteor., 24, 1383-1387.
 First harmonic time of
maximum rainfall frequency for all events. Ibid
First harmonic time of
maximum rainfall frequency for all events. Ibid
 Contour
map of OLR for January. Bull. Am. Meteor. Soc., 70, p. 480.
Contour
map of OLR for January. Bull. Am. Meteor. Soc., 70, p. 480.
 Contour
map of OLR for July. Bull. Am. Meteor. Soc., 70, p. 480.
Contour
map of OLR for July. Bull. Am. Meteor. Soc., 70, p. 480.
 Standard deviation map of
change in interannual OLR for JJA and DJF. Bull. Am. Meteor. Soc., 70, p. 480.
Standard deviation map of
change in interannual OLR for JJA and DJF. Bull. Am. Meteor. Soc., 70, p. 480.
 ERBE monthly mean LWRE for
April 1985. Bull. Am. Meteor. Soc., 69, p. 1144.
ERBE monthly mean LWRE for
April 1985. Bull. Am. Meteor. Soc., 69, p. 1144.
 Diurnal range of LWRE from
ERBE for April 1985. Bull. Am. Meteor. Soc., 69, p. 1144.
Diurnal range of LWRE from
ERBE for April 1985. Bull. Am. Meteor. Soc., 69, p. 1144.
 ERBE monthly mean clear-sky
LWRE for April 1985. Bull. Am. Meteor. Soc., 69, p. 1144.
ERBE monthly mean clear-sky
LWRE for April 1985. Bull. Am. Meteor. Soc., 69, p. 1144.
 Diurnal range of clear-sky
LWRE for April 1985. Bull. Am. Meteor. Soc., 69, p. 1144.
Diurnal range of clear-sky
LWRE for April 1985. Bull. Am. Meteor. Soc., 69, p. 1144.