 Figure 1 - Physical data for bodies
with atmospheres. Source unknown.
 Figure 2 - Solar system bodies with
substantial atmospheres. Source unknown.
Figure 3 - Four
stages of evolution of the Earth's atmosphere.
 Figure 4 - Solar flux; second approximation.
 Figure 5 - Energy flux vs. wavelength.
 Figure 6 - Absorption spectra for
H2O, CO2, O2, N2O, CH4, in the atmosphere. (After J. N. Howard, 1959: Proc. I.R.E. 47, 1459; and R.
M. Goody and G.D. Robinson, 1951: Quart. H. Roy. Meteorol. Soc. 77, 153)
 Figure 7 - Solar flux; third approximation.
Figure 8 - Actual and equilibrium concentrations of constituents of the Earth's atmosphere. Source unknown.
 Figure 9 - NASA: Temperature distribution in
the atmosphere. From pattern to process: the strategy of the earth observing system.
Volume II, 140 pp.
 Figure 10 - The reactions leading to
oxygen formation in the prebiotic atmosphere. Source unknown.
 Figure 11 - Abundance of ozone and
oxygen from 4.6 billion years to present. Source unknown.
 Figure 12 - The cycle of oxygen in
nature. Source unknown.
Related Class Images
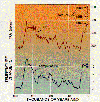
 Changes in global
atmospheric CO2 and global surface temperature over the last 160,000 years. U.S. Global Change
Research Program Adapted and corrected from Woodwell, et. al. Scientific American, April 1989.
 Concentration of
gases vs. altitude. Source unknown.