
|
|
|
|
|
|
|
|
|
|
|
|
|
|
 |
|||||||
|
|
|
|
|
|
|
|
|
||
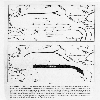 Figure 1 -
Relationship between the Southern Ocillation and El Nino. Lutgens, Frederick K., and Edward J. Tarbuck, 1986: the Atmosphere.
An Introduction to Meteorology. Prentice Hall Inc., Englewood Cliffs, NY. pg 214.
 Figure 2 - Weather Changes
Related Class Images
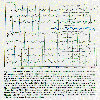 Time series of selected variables whose interannual variability is related to the ENSO phenomenon.
 Sea-surface temperature anomalies from 1968 - 1984.
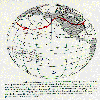 A schematic diagram of the PNA pattern of middle and upper-tropospheric geopotential height anomalies during a NH winter that coincides with El Nino conditions.
 Cross section of the current system off the Peruvian coastline.
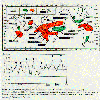 Schematic diagram of areas and times of the year with a consistent ENSO precipitation signal and monthly tropical sea surface and land air temperature anomalies 1961-1989.
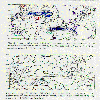 Average May-June 1988 SST anomalies and average May-June 1988 OLR anomalies.
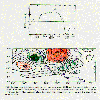 Average geopotential height anomalies at 300 mb for April-May-June 1988.
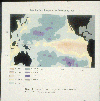 Sea surface temperature anomalies
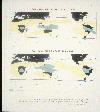 Calculated OLR for DJF 1982-1983
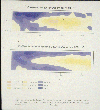 Observed SSTA for December 1991
 Contours of the composite SST anomaly taken from ship track data angenerated by the six El Ninos between 1949 and 1981.
Back to Unit Page