
|
|
|
|
|
|
|
|
|
|
|
|
|
|
|
|||||||
|
|
|
|
|
|
|
|
|
||
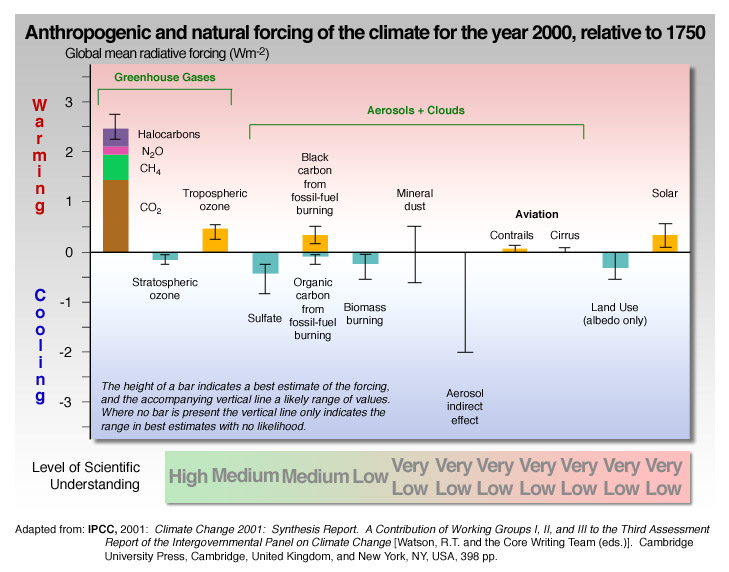
Global Cooling
The emphasis to this point has been on atmospheric constituents that lead to global warming. However, other factors lead to a cooling, as described in Figure 6. Atmospheric factors shown in this sketch include natural factors such as upper sides of clouds, volcanic eruptions, natural biomass burning, and dust from storms. In addition, human-induced factors such as biomass burning (forest and agricultural fires) and sulfate aerosols from burning coal contribute tiny particles that contribute to cooling.
Combined Effects on Radiative Forcing
Best estimates of the combined warming and cooling
effects, as reported in the 2001 report of the Intergovernmental Panel on
Climate Change, are shown in
Figure 7.
Also included in this graph is the effect of changing land use on surface
albedo (absorption of solar radiation at the surface). To underscore the
importance of human-induced activities, the right-hand-most bar in the
graph shows the contribution to radiative forcing from variations in
output of the sun. These results show that current anthropogenic
greenhouse gas forcing is about 5 times larger than natural variation for
2000, and, from the results of Figure 6, could be 10 to 20 times larger
than natural variation by the end of the 21st century. Plots of current
and future projected concentrations of carbon dioxide with past values
over geological time scales are given in Figures 8-11. Noteworthy are
both the magnitudes of the future projections and the timescales over
which these changes are occurring, compared to natural variations.
The future emission scenario that ultimately occurs
will determine how the long term trend of atmospheric CO2
changes. Figure 8 shows
current levels
compared to the historical record of the past 400,000 years. Figure 9 gives the likely
CO2
level in 2040 since we have little hope for abrupt reductions from current
emissions patterns. An upper limit target that frequently is quoted is to
stabilize (not exceed) twice the pre-industrial value (see Figure 10). If we follow
the
"business as
usual" A1T scenario, the atmospheric CO2 level in 2100 is shown
in Figure 11.
In Block 2 of this course we will examine, by use of
global climate
models, the impact on climate due to these changes in atmospheric
constituents.