
|
|
|
|
|
|
|
|
|
|
|
|
|
|
|
|||||||
|
|
|
|
|
|
|
|
|
||
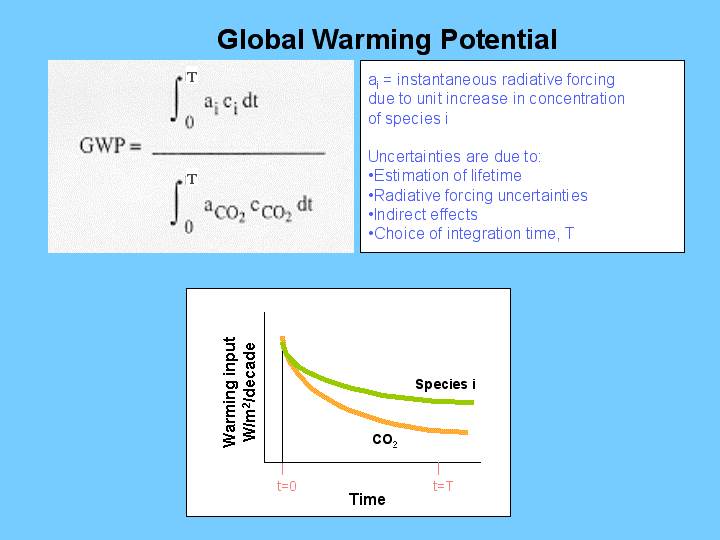 Figure 1 - Global
Warming Potential
Figure 1 - Global
Warming Potential
 Figure 2 -
Numerical estimates of Global Warming Potential. Adapted from
IPCC, 2001, p 189.
Figure 2 -
Numerical estimates of Global Warming Potential. Adapted from
IPCC, 2001, p 189.
 Figure 3 -
Example of use of Global Warming Potentials. Adapted from IPCC, 1990, p 61.
Figure 3 -
Example of use of Global Warming Potentials. Adapted from IPCC, 1990, p 61.
 Figure 4 - Four
families of scenarios.
Figure 4 - Four
families of scenarios.
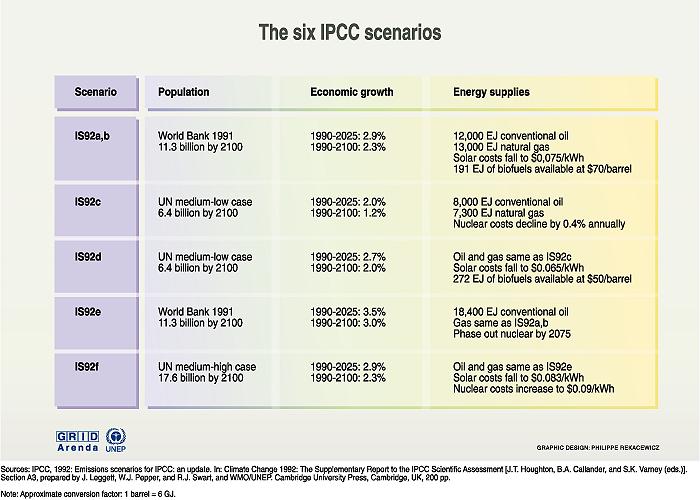 Figure 5 - The six IPCC scenarios. IPCC,
1992
Figure 5 - The six IPCC scenarios. IPCC,
1992
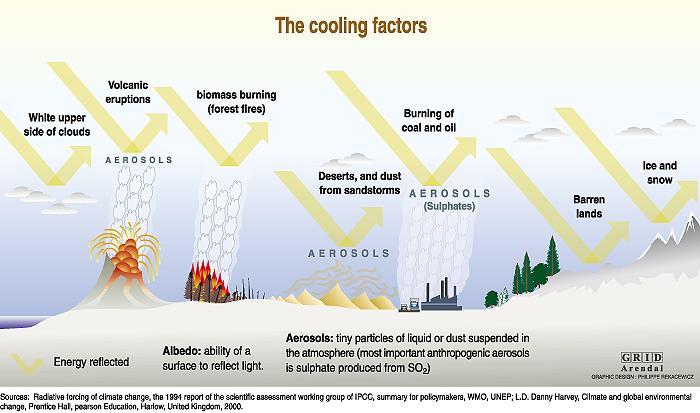 Figure 6 - The cooling factors. IPCC,
1991.
Figure 6 - The cooling factors. IPCC,
1991.
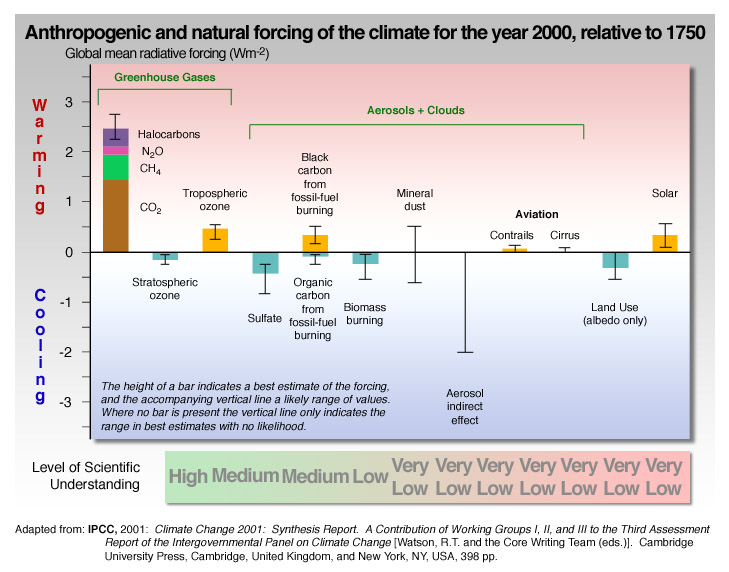 Figure 7 - Anthropogenic and natural forcing of
the climate for the year 2000, relative to 1750. IPCC, 2002, p 48
Figure 7 - Anthropogenic and natural forcing of
the climate for the year 2000, relative to 1750. IPCC, 2002, p 48
 Figure 8 - Temperature and CO2 up to 2002
 Figure 9 - Temperature and CO2 up to
2040
Figure 9 - Temperature and CO2 up to
2040
 Figure 10 - Temperature and CO2
stabilization point
Figure 10 - Temperature and CO2
stabilization point
 Figure 11 - Temperature and CO2 "Business as
Usual"
Figure 11 - Temperature and CO2 "Business as
Usual"
Back to Unit Page