
|
|
|
|
|
|
|
|
|
|
|
|
|
|
 |
|||||||
|
|
|
|
|
|
|
|
|
||
 Figure 1 - Trend in global average surface
temperature through 2005
 Figure 2 -
Changes of maximum and minimum temperatures. IPCC, 1990.
 Figure 3 -
Annual precipitation anomalies. IPCC, 1990.
Figure 4 - Precipitation changes: trend over land from 1900 to 1994
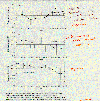 Figure 5 -
Temperature anomalies in the troposphere and lower stratosphere 1958-1989. IPCC, 1990.
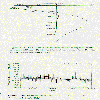 Figure 6 -
Sub-surface ocean temperature changes and Northern hemisphere snow extent anomalies. IPCC, 1990.
 Figure 7 -
Sea-ice changes. IPCC, 1990.
Figure 8 - Thinning of the Arctic sea-ice
Related Class Images
 Global annual temperature anomalies. Trends 1993.
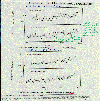 Global and hemispheric anomalies. Ibid.
 Sea-surface temperature anomalies 1861-1989.. IPCC, 1990.
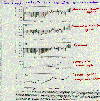 Combined land-air and sea-surface temperatures. IPCC, 1990.
 Problems with global temperature records.. Takle, 1995.
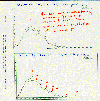 Humans may inadvertently introduce biases in observed data. (Wind speed distributions for Des Moines and Sioux City.).
 Coverage of land surface air and sea surface temperature data..