
|
|
|
|
|
|
|
|
|
|
|
|
|
|
|
|||||||
|
|
|
|
|
|
|
|
|
||
Representing Plant Functions in Sib
SVATs are constructed to give proper representation of the flow of mass, momentum, energy,
and trace gases (e.g., water vapor, CO2) between the surface and the atmosphere. The flow of
these quantities in a unit of time is called flux. The definitions of heat, mass, and momentum
fluxes are given in Figure
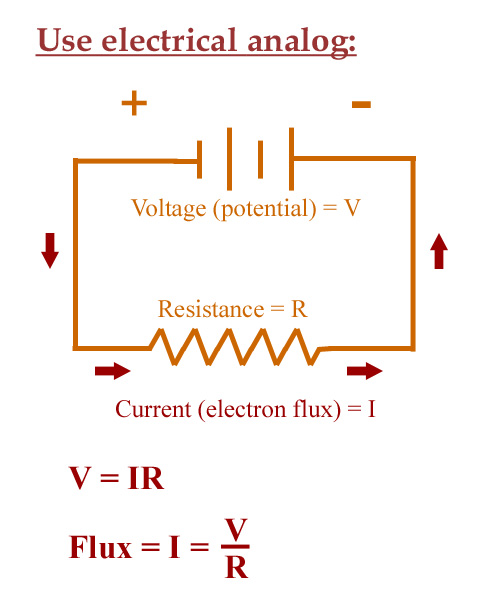
3. The fluxes are related to measurable variables (like temperature or relative humidity) by use
of a simple electrical resistance analog
(Figure 4c): V = I x R,
where V is voltage (sometimes called the potential difference), I is electrical current,
and R is resistance. The flux is analogous to the current, I = V/R. Figure 4d gives the method
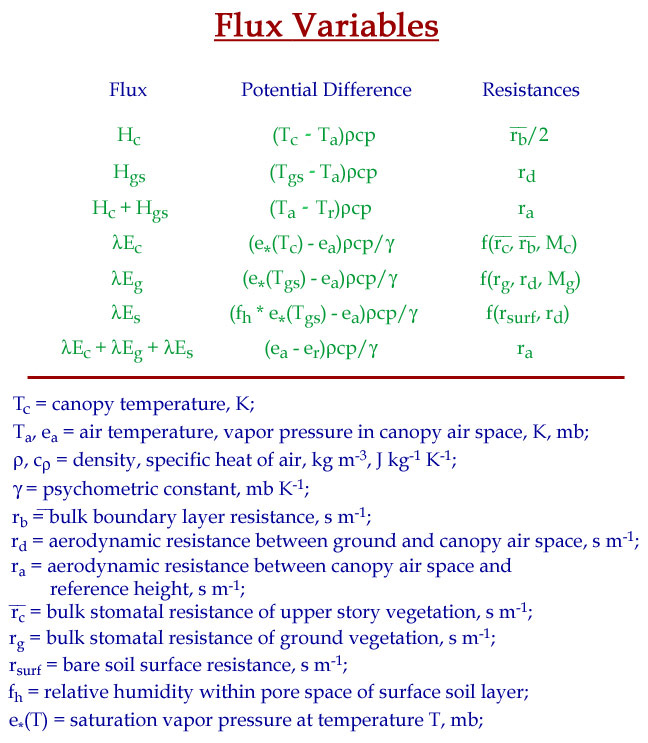
for calculating, say, the heat flux out of the plant canopy in terms of the potential
difference (essentially the difference between the temperatures of the air and canopy) and
the "resistance" of the atmosphere. Similar expressions are given for other heat fluxes and
also the fluxes of water vapor from the plants and the soil surface.
A schematic depicting the various resistances for the atmosphere, plant canopy, ground cover plants, and soil is given in Figure 5. A detailed depiction of the plant stomates in Figure 6 shows that when the stomates open to allow carbon dioxide to flow in, they also allow water vapor to flow out. The plant thereby uses the size of the stomatal opening to regulate its uptake of CO2 and also to keep it cool by allowing water to evaporate within the stomate and escape to the atmosphere.<
From these definitions, as shown in Figure 7 , we can develop equations for the conservation of energy (equations 1 and 2) and conservation of water substance (equations 3 and 4). In a similar way, equations describing soil wetness in each of the three soil layers can be assembled from the conservation of water as shown by equations 5, 6, and 7 of Figure 8.
The various classes of vegetation are given in Table 2 of Figure 9. When a SVAT is used in conjunction with a global or regional climate model, each grid cell of the climate model must have a "land-use" class given in Table 2 of Figure 9.
A plant physiologist likely would consider these representatives of plant processes to be quite simplistic. However, experiments have shown that global and regional models that represent surface processes by SVATs such as SiB give more accurate simulation of basic climate variables.