|
|
|
|
|
|
|
|
|
|
|
|
|
|
 |
|||||||
|
|
|
|
|
|
|
|
|
||
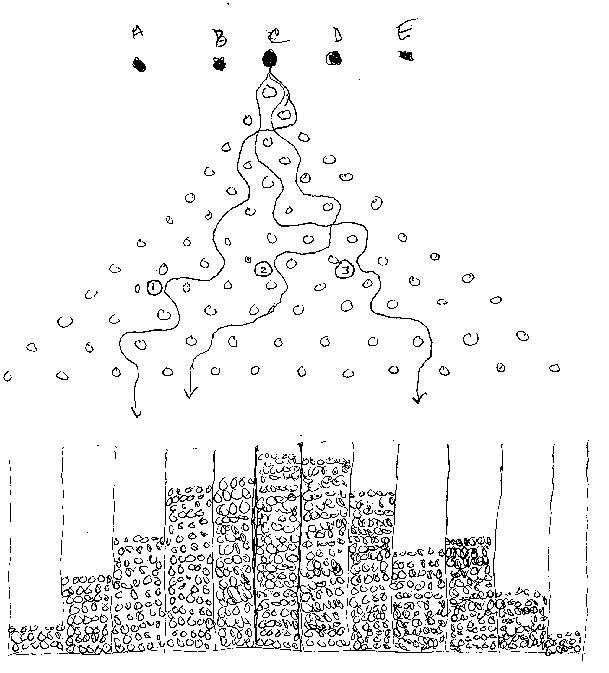
To understand the concept of a climate model and to clarify the concept of climate predictions as compared to weather predictions, we consider the "pinball machine analogy". This is not a real model for simulating climate but only an analogy that will help distinguish weather from climate and observe how changing certain conditions changes the climate statistics. The accompanying sketch shows the result of many outcomes of dropping balls through the pinball matrix. If the matrix is very large there will be many, many individual paths to the bottom. The exact positions of the pegs determine the distribution of balls at the bottom. A slight change in peg position will have some influence on the distribution of possible paths, with some pegs being more influential than others.

A weather forecast for a specific day is analogous to an individual path through the matrix. Each horizontal line of pegs might represent a successive day. If we know from which position (A, +/-B....+/-E) the ball started (i.e. if we know the initial conditions for the differential equations describing the atmospheric motions), we will know reasonably well the first part of the trajectory through the matrix but less and less as the ball moves downward. After the ball passes several pegs, our predictability of the actual path is completely lost (the equations are nonlinear and dissapative and include some approximations).
A climate forecast is analogous to the distribution of balls at the bottom of the matrix. If we know the positions of the pegs, the equations that describe (with some uncertainty at each bounce) the trajectory through the matrix, and the number of times each initial condition is used, we can estimate the distribution at the bottom. In this case, an individual trajectory through the matrix does not represent a forecast of day-by-day actual weather, but rather a plausible sequence of daily weather consistent with the known positions of all the pegs.
Another feature of the climate prediction problem is that if the range of initial conditions (starting points A, +/-B....+/-E) remains limited (limited horizontal distance in the pinball sketch) but the size of the matrix is extended downward (length of the forecast period is increased), then eventually the distribution of final outcomes at the bottom will be essentially independent of how many times the ball started at A, +/-B....+/-E. We say that the ball forgets its initial conditions or that the outcome is independent of initial conditions and depends only on the positions of the pegs (e.g., the boundary conditions).
A change in greenhouse gas concentration is analogous to changing the positions of one or more pegs. The change this creates in individual trajectories (e.g., weather for a particular year) might not be noticeable, but over a larger number of events (many years) a slight change might become detectable.
Suppose the real climate system is given by a pinball matrix for which we do not know the exact peg positions or the elasticity of the pegs (how far the ball rebounds after hitting a peg). We will try to understand the real climate system by building a matrix that looks as close to the real matrix as we can make it. We use pegs of material that gives rebounds as close as possible to the real matrix.
The trajectory through a given matrix is described by a single set of equations, so by extension, we say that the set of equations and peg positions is the "model" that describes the behavior of the matrix. This "model" can be used to predict the distribution of balls at the bottom (i.e., the climate). We test how well the model works by comparing its predicted results with outcomes from the real matrix. We might find in making this comparison that we need to adjust some constants or compensate for subtle influences (this is called "tuning the model"). This is analogous to using the climate model to predict the characteristics of the present climate. Once we have it working well for a given set of matrix conditions, we should change the real matrix slightly by moving a few pegs slightly (analogous to finding a different real climate, such as an ice-age climate), make comparable changes in the mathematical conditions in the model, and compare model and real outcomes. This is typically done by studying the climate that existed 15,000 years ago during the last ice age (we will discuss later how we get the observed conditions for comparison with model results).
If these "reality checks" prove successful, we feel confident that we can use the model to predict the effects of changing pegs to some configuration for which there are no observed results. This is analogous to making predictions of the effect of changing the "peg" (e.g., equations or conditions) representing increases of greenhouse gases.
Public Access to Pinball Climate Simulation Assignment Page