
|
|
|
|
|
|
|
|
|
|
|
|
|
|
|
|||||||
|
|
|
|
|
|
|
|
|
||
Model Comparison
We continue our comparison of global climate model simulations with those of
other models and with observed values. Figure
1 shows comparison of temperature
(top) and precipitation (bottom) for different global climate models in
different regions of the globe. Two sets of observations are listed on
this table to show that when averaging over large regions, particularly
where actual measurements are sparse, there is some lack of agreement. The
five regions represent the US Great Plains, Southeast Asia, the Sahel
(Africa just below the Sahara Desert), Southern Europe, and Australia. Notice again that no one model seems to
uniformly excel in representing temperature and precipitation. And also,
in some cases the low-resolution models give better results than
high-resolution models.
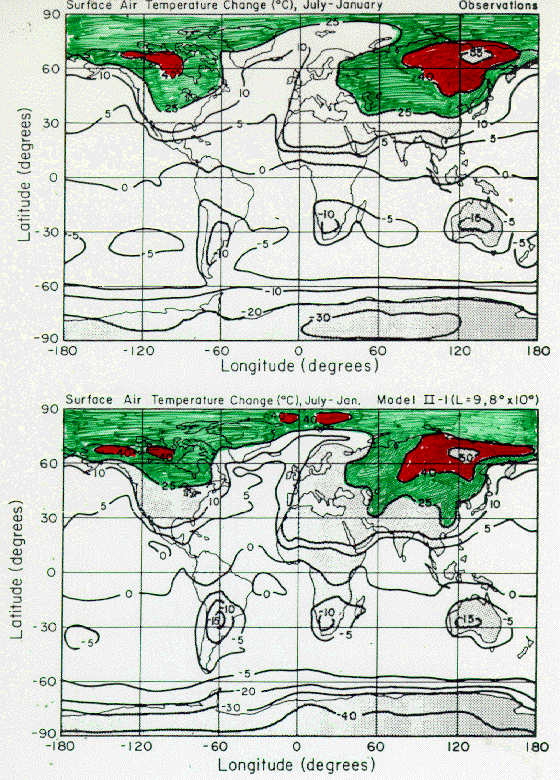
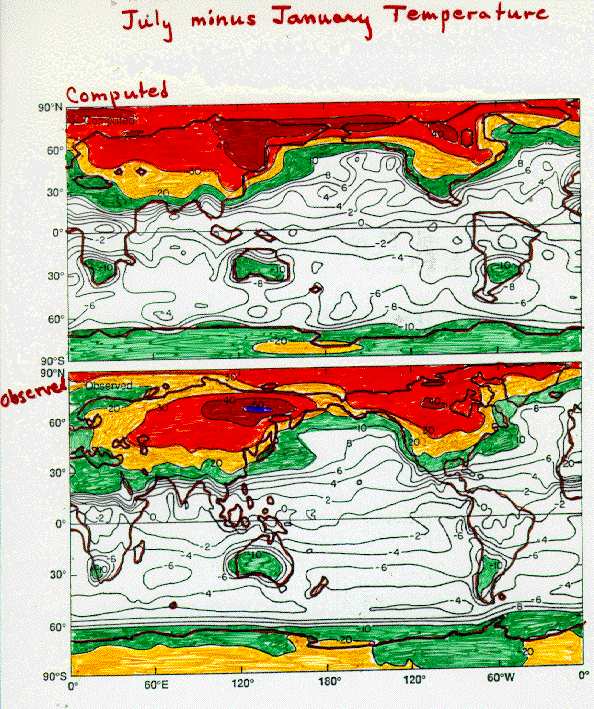
Figure 2 shows how one model, in this case the Goddard Institute for Space Studies (GISS) model, reproduces the global pattern of surface temperature difference between July and January. Observations are given in the upper panel and model results in the lower panel. Being a plot of difference, this map does not indicate how well the model simulates absolute temperature but rather the seasonal change from summer to winter. I have colored regions in the Northern Hemisphere with seasonal temperature differences larger than 25oC in green and regions larger than 40oC in red in both plots. The model evidently produces quite good seasonal temperature shifts as indicated by agreement between model and observations over large areas in North America and Russia. Figure 3 gives a similar plot for a different model (the NCAR model), with the model results in the upper panel and observations below. The results for this model are similar to those of the GISS model.
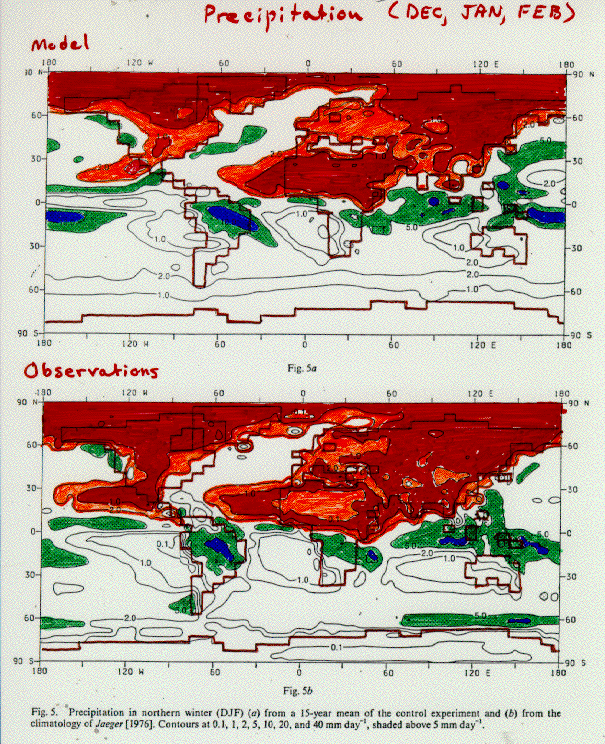
Figure 4, the accompanying two-panel map, gives the model results and observations for December-January-February (DJF) precipitation. This is from a fairly coarse resolution model (notice, for example, that the US does not include the Florida peninsula). If comparison is made for an isolated point on the map, the differences between model and observations will likely be large. However, the overall patterns are quite good and suggests that the model captures key large-scale features of global precipitation even if local values have large errors.