|
|
|
|
|
|
|
|
|
|
|
|
|
|
 |
|||||||
|
|
|
|
|
|
|
|
|
||
 Figure 1 - Basic equations of climate models. Takle, E.S., 2002
 Figure 2 -
Land-surface parameterization scheme. NCAR/TN-275 +STR Biosphere-Atmosphere Transfer Scheme (BATS) for the NCAR CCM.
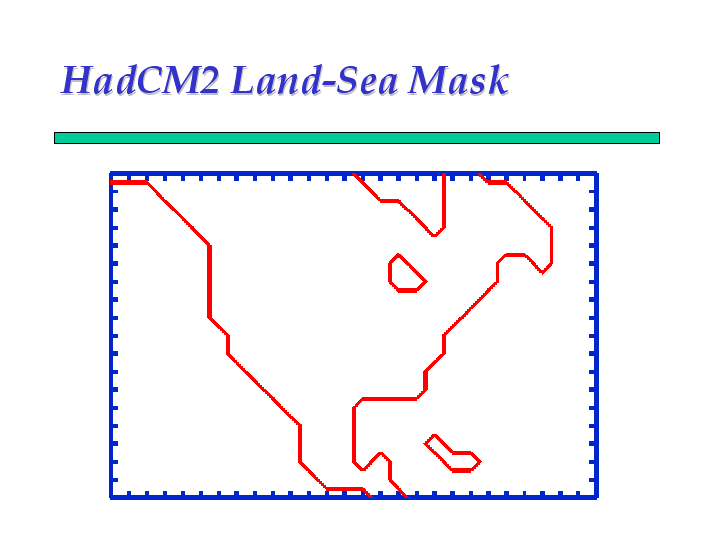
 Figure 4 - HadCM2 Land-Sea Mask
 Figure 5 -
High resolution (hypothetical) grid. Cushman and Ferres, Climate Change
Quarterly, 77.
 Figure 6 -
Computational domain for a regional climate model. NCAR/TN - 381 +1A. A
user's guide to the Penn State/NCAR mesoscale modelling system.
 Figure 7 -
Zonal-average mean sea-level pressure. Adapted from Figure 4.1 IPCC, 1990.
 Figure 8 -
Zonal-average air temperature. Adapted from Figure 4.8 IPCC, 1990.
 Figure 9 -
Zonal-average precipitation. Adapted from Figure 4.10 IPCC, 1990.
 Figure 10 -
Zonal-average soil moisture. Adapted from Figure 4.12 IPCC, 1990.
 Figure 11 -
Zonally-averaged JJA and DJF sea-level pressure simulated by current high resolution GCMs. Adapted from Figure B27 IPCC, 1990.
 Figure 12 -
The development of climate models, past, present, and future. From
IPCC.
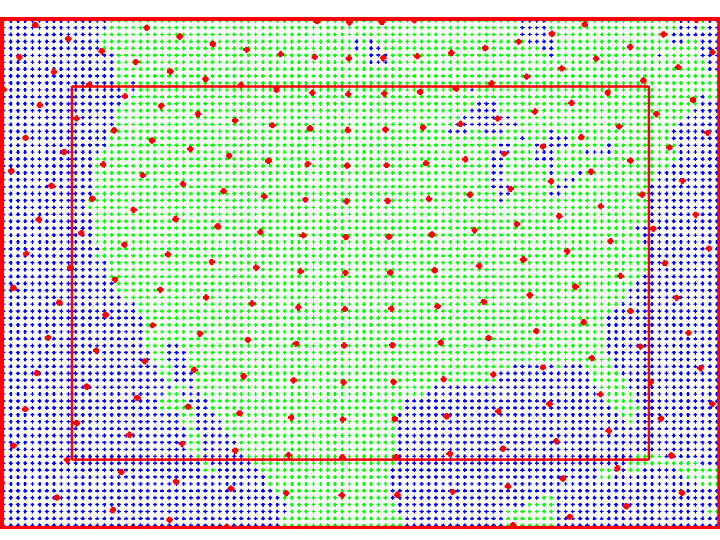
 Regional
grid used for PIRCS study
Back to Unit Page