
|
|
|
|
|
|
|
|
|
|
|
|
|
|
|
|||||||
|
|
|
|
|
|
|
|
|
||
Temperature, Precipitation, and Soil Moisture
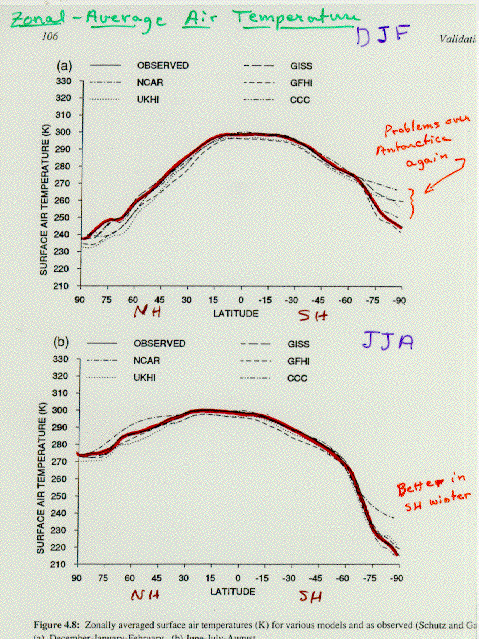
Figure 8 compares model results for simulating temperature for the same two seasons as the previous plot. All models do quite well in
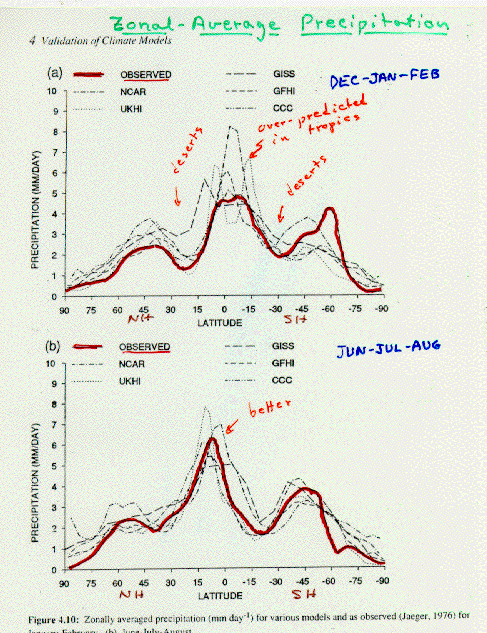
all regions except near the South Pole. Zonal-average precipitation (Figure 9)
produced by global models show some of the weakness of climate simulation.
The observations show high-precipitation regions in the tropics (near
latitude 0o) and the mid-latitudes (45o-60oN and S). Most models show the
correct placement of the precipitation maxima, but close examination
reveals that the relative size of the errors typically range from about 20
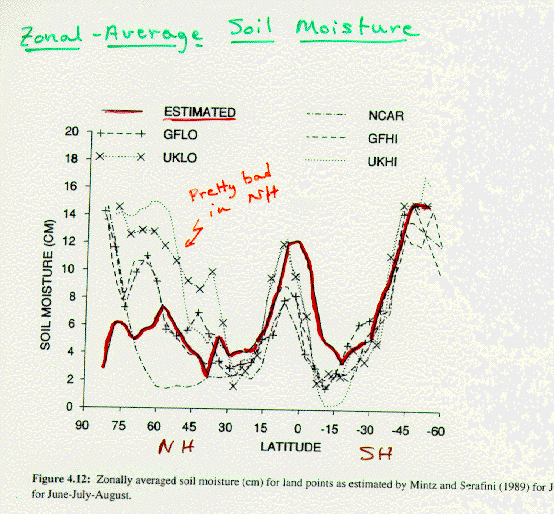
to 100%. Figure 10 shows how well models simulate soil
moisture. The models give poor representations of soil moisture in the
Northern Hemisphere. In the tropics where the soil is moist most of the
time, the models do much better. In the subtropical high pressure zones
the soil is usually dry, so again the models do well. So in general, the
models do quite well in areas where the soil moisture doesn't change much
but not very well where there are large fluctuations.