
|
|
|
|
|
|
|
|
|
|
|
|
|
|
|
|||||||
|
|
|
|
|
|
|
|
|
||
Temperature and CO2
Correlation
Reconstructed Earth Surface
Temperature, 1000-2000
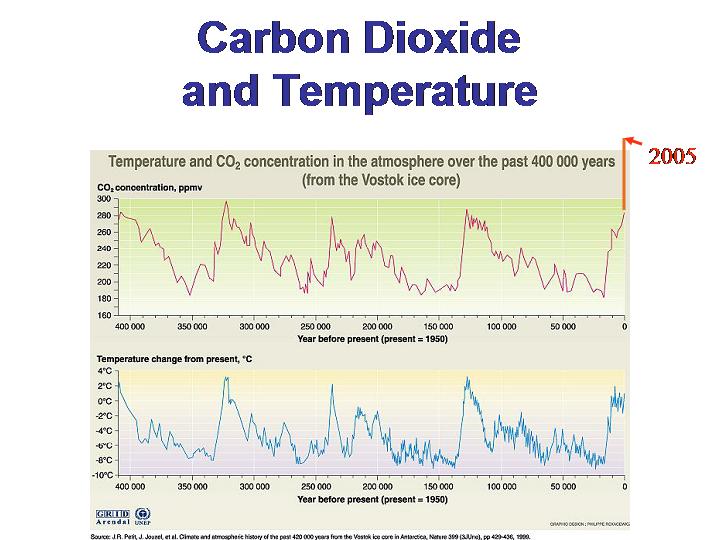
If we plot current atmospheric CO2 levels on the historical record of Figure 4 we see that
current
levels far exceed levels of the last 400,000 years (Figure 6). If
human-induced emissions of the CO2
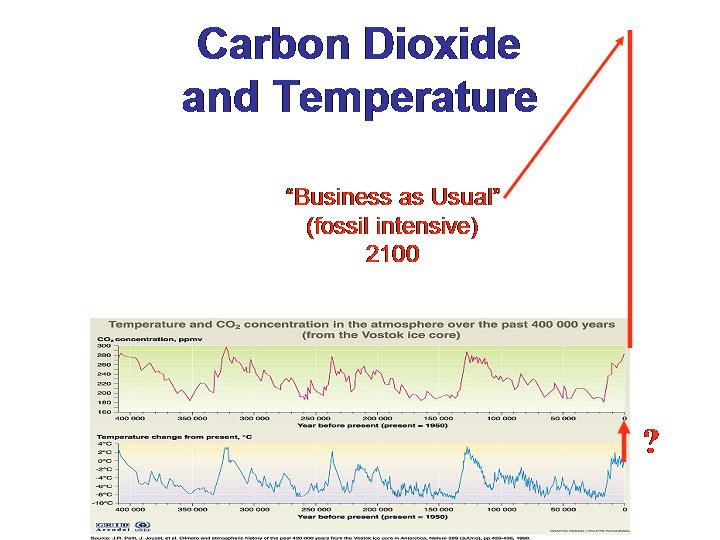
continue at current rates of increase, atmospheric CO2 will surpass 300% of pre-industrial levels by 2100
(Figure 7). The question then is what happens to global mean
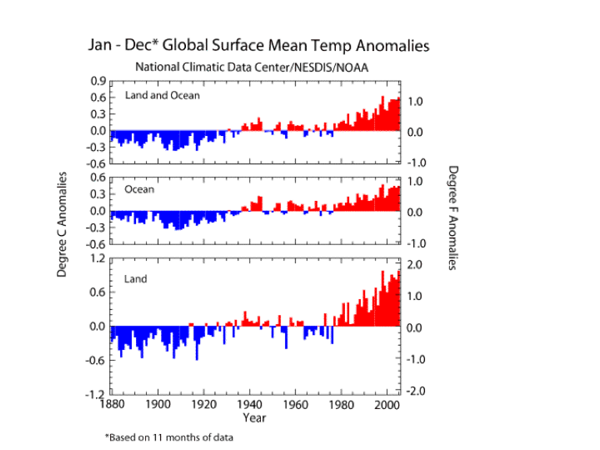
temperatures on the graph in Figure 7? Is the recent
rise in temperature shown in Figure 3
the early sign of the
trend to be expected in Figure 7?
PREVIOUS: Global-Average Surface Temperature
NEXT: Other Chemicals for Concern
From a plot of atmospheric CO2 and Earth surface temperature over the
last 400,000 years (Figure
4) we see a strong correlation between temperature and CO2. It
is noteworthy that the concentration of CO2 during this period did
not exceed 300 ppmv, in contrast to recent measurements that show
concentrations exceeding 370 ppmv and rising steadily.
A 1999 report by Mann et al (1999) shows that the surface temperature
change for Planet Earth over the last 1,000 years as reconstructed from ice
cores, lake sediments and tree rings (Figure 5). The
yellow bars on this graph show the range of uncertainty for each proxy
measurement. Overall the graph shows that the temperature of the planet has
decreased gradually over the period from year 1000 to about 1900. Since then, the
temperature has risen abruptly at a rate uncharacteristic of the behavior of the
preceding 900 years. This graph provides strong evidence that conditions of the
planet have changed dramatically in the last 100 years.