
|
|
|
|
|
|
|
|
|
|
|
|
|
|
|
|||||||
|
|
|
|
|
|
|
|
|
||
 Figure 2 - Atmospheric CO2
concentrations at Barrow, Ak, Mauna Loa, Hi, American Samoa, and South
Pole. American Scientist, 78, 325 (1990). Permission granted by Sigma, Xi, The
Scientific Research Society.
Figure 2 - Atmospheric CO2
concentrations at Barrow, Ak, Mauna Loa, Hi, American Samoa, and South
Pole. American Scientist, 78, 325 (1990). Permission granted by Sigma, Xi, The
Scientific Research Society.
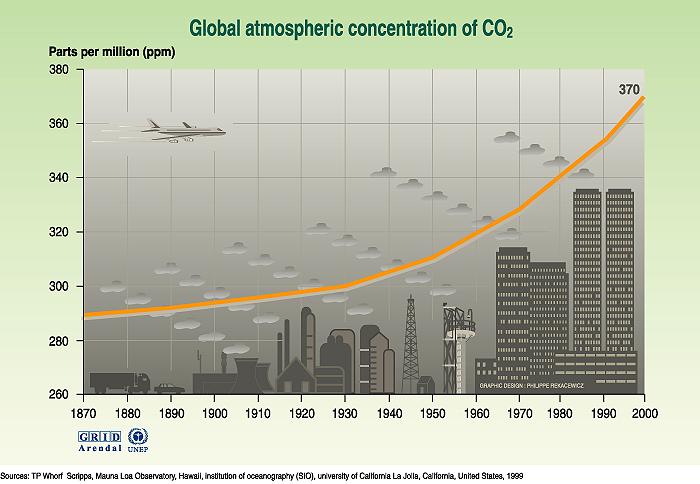 Figure 3 -
Atmospheric CO2 since
the beginning of the Industrial Revolution. EPA.
Figure 3 -
Atmospheric CO2 since
the beginning of the Industrial Revolution. EPA.
 Figure 4 - Changes in global
atmospheric CO2 and global surface temperature over the last 160,000 years. U.S. Global Change
Research Program
Figure 4 - Changes in global
atmospheric CO2 and global surface temperature over the last 160,000 years. U.S. Global Change
Research Program
Figure 5 - Temperature and CO2 concentration in the atmosphere over the past 400,000 years from UNEP.
 Figure 6 - Definitions for Discussing
Global Quantities.
Figure 6 - Definitions for Discussing
Global Quantities.
 Figure 7 - Net release of carbon from
tropical deforestation. EPA, 1989: Policy options for stabilizing
global climate.
Figure 7 - Net release of carbon from
tropical deforestation. EPA, 1989: Policy options for stabilizing
global climate.
 Figure 8 - Carbon dioxide emissions
from cement production EPA, 1989: Policy options for stabilizing
global climate.
Figure 8 - Carbon dioxide emissions
from cement production EPA, 1989: Policy options for stabilizing
global climate.
 Figure 9 - Fossil fuel emissions.
American Scientist, 78, 310 (1990). Permission granted by Sigma, Xi, The
Scientific Research Society.
Figure 9 - Fossil fuel emissions.
American Scientist, 78, 310 (1990). Permission granted by Sigma, Xi, The
Scientific Research Society.
 Figure 10 -
CO2 emissions due to
fossil fuel consumption. EPA.
Figure 10 -
CO2 emissions due to
fossil fuel consumption. EPA.
 Figure 11 - Seven box schematic of the
carbon cycle NASA
Figure 11 - Seven box schematic of the
carbon cycle NASA
 Figure 12 - Euphotic and Aphotic Zones.
 Figure 13 - Essential nutrients for ocean
plants
Figure 13 - Essential nutrients for ocean
plants
.
 Figure 14 - Biological activity in the
oceans of the southern hemisphere American Scientist
July/Aug 1990. Permission granted by Sigma, Xi, The Scientific Research
Society.
Figure 14 - Biological activity in the
oceans of the southern hemisphere American Scientist
July/Aug 1990. Permission granted by Sigma, Xi, The Scientific Research
Society.
 Figure 15 - Biological activity in the
oceans of the northern hemisphere American Scientist
July/Aug 1990. Permission granted by Sigma, Xi, The Scientific Research
Society.
Figure 15 - Biological activity in the
oceans of the northern hemisphere American Scientist
July/Aug 1990. Permission granted by Sigma, Xi, The Scientific Research
Society.
 Figure 16 - Mean near-surface
phytoplankton pigment concentrations. NASA
Figure 16 - Mean near-surface
phytoplankton pigment concentrations. NASA
 Figure 17 - Vertical distribution of
carbon dioxide in the air around a forest varies with time of day.
J. D. Butler, Air Pollution Chemistry, 1979.
Figure 17 - Vertical distribution of
carbon dioxide in the air around a forest varies with time of day.
J. D. Butler, Air Pollution Chemistry, 1979.
 Figure 18 - July-August global plant
biological activity as determined by the Global Vegetative Index. American Scientist
78, 322 (1990). Permission granted by Sigma, Xi, The Scientific Research Society.
Figure 18 - July-August global plant
biological activity as determined by the Global Vegetative Index. American Scientist
78, 322 (1990). Permission granted by Sigma, Xi, The Scientific Research Society.
 Figure 19 - January-February global plant
biological activity as determined by the Global Vegetative Index. American Scientist
78, 322 (1990). Permission granted by Sigma, Xi, The Scientific Research Society.
Figure 19 - January-February global plant
biological activity as determined by the Global Vegetative Index. American Scientist
78, 322 (1990). Permission granted by Sigma, Xi, The Scientific Research Society.
 Figure 20 - Productive potential of the
Earth's vegetative biomass. NASA
Figure 20 - Productive potential of the
Earth's vegetative biomass. NASA
Related Class Images
 Global concentrations of
methane in the troposphere. Adapted from Blake and Rowland (1987).
Global concentrations of
methane in the troposphere. Adapted from Blake and Rowland (1987).
 Average atmospheric methane
concentrations. Adapted from Khalil and Rasmussen, C and E News,
64 (47), 23.
Average atmospheric methane
concentrations. Adapted from Khalil and Rasmussen, C and E News,
64 (47), 23.
 Methane,
CO2 and
temperature profiles. Adapted from Woodwell et al, Scientific
American, April 1989
Methane,
CO2 and
temperature profiles. Adapted from Woodwell et al, Scientific
American, April 1989
Estimated sources and sinks of methane. Adapted from the IPCC supplemental Report, 1992.
 Trends in domestic animal
population (1890-1985). EPA, 1989: Policy options for stabilizing global
climate.
Trends in domestic animal
population (1890-1985). EPA, 1989: Policy options for stabilizing global
climate.
 Rough rice production
(1984). EPA, 1989: Policy options for stabilizing global
climate.
Rough rice production
(1984). EPA, 1989: Policy options for stabilizing global
climate.
Estimated sources and sinks of carbon monoxide. EPA, 1989: Policy options for stabilizing global climate.
 N2O concentrations from
1977-1988 and past 2000 years. Houghton, J.T., G.J. Jenkins, J.J.
Ephraums eds, 1990: 1990 Intergovernment Panel on Climate Change,
Cambridge University Press, 364 pp.
N2O concentrations from
1977-1988 and past 2000 years. Houghton, J.T., G.J. Jenkins, J.J.
Ephraums eds, 1990: 1990 Intergovernment Panel on Climate Change,
Cambridge University Press, 364 pp.
 Estimated sources and sinks of
nitrous oxide. IPCC, 1990.
Estimated sources and sinks of
nitrous oxide. IPCC, 1990.
 Nitrogen
fertilizer consumption. EPA: Policy Options for Stabilizing Global
Climate.
Nitrogen
fertilizer consumption. EPA: Policy Options for Stabilizing Global
Climate.