
|
|
|
|
|
|
|
|
|
|
|
|
|
|
|
|||||||
|
|
|
|
|
|
|
|
|
||
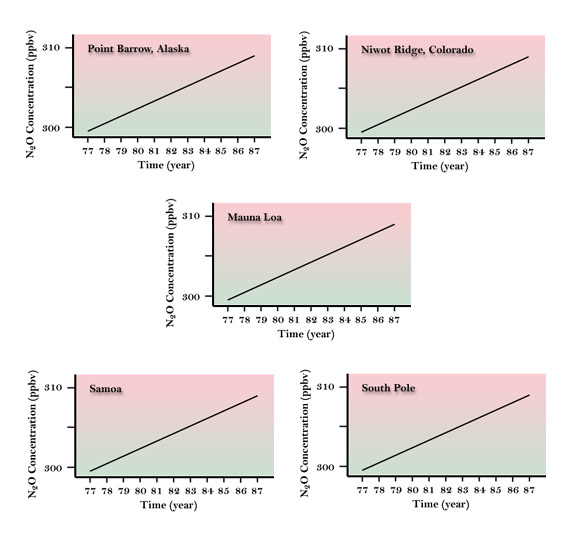 Figure 1a - Atmospheric concentration of
N2O from 1977-1988.
Houghton, J.T., G.J. Jenkins, J.J. Ephraums,
eds, 1990: 1990 Intergovernment Panel on Climate Change, Cambridge University Press.
Figure 1a - Atmospheric concentration of
N2O from 1977-1988.
Houghton, J.T., G.J. Jenkins, J.J. Ephraums,
eds, 1990: 1990 Intergovernment Panel on Climate Change, Cambridge University Press.
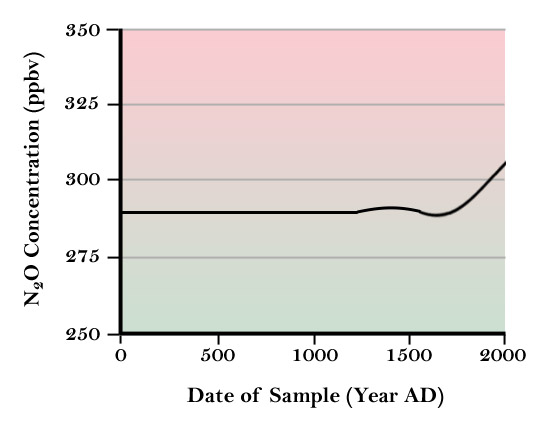 Figure 1b - Atmospheric concentration of N2O
from the last 200 years. Houghton, J.T., G.J. Jenkins, J.J. Ephraums, eds,
1990: 1990 Intergovernment Panel on Climate Change, Cambridge
University Press.
Figure 1b - Atmospheric concentration of N2O
from the last 200 years. Houghton, J.T., G.J. Jenkins, J.J. Ephraums, eds,
1990: 1990 Intergovernment Panel on Climate Change, Cambridge
University Press.
Figure 2 - Estimated sources and sinks of nitrous oxide. Adapted from table 1.4, p 26, of Houghton, J.T., G.J. Jenkins, J.J. Ephraums, eds, 1990: 1990 Intergovernment Panel on Climate Change, Cambridge University Press
 Figure 3 -
Nitrogen fertilizer consumption. EPA.
Figure 3 -
Nitrogen fertilizer consumption. EPA.
 Figure 4 -
Annual vs emissions of NOx and SO2 from 1900-1980. EPA.
Figure 4 -
Annual vs emissions of NOx and SO2 from 1900-1980. EPA.
Figure 5 - Estimated Sources of Nitrogen Oxides
 Figure 6 -
Nitrogen cycle. J. D. Butler, Air Pollution Chemistry, 1979
Figure 6 -
Nitrogen cycle. J. D. Butler, Air Pollution Chemistry, 1979
 Figure 7 - Biogeochemical Processes. U.S. Global Change Research Program.
 Figure 8 -
Estimated annual global sulfur emissions from 1860-1980. Source unknown.
Figure 8 -
Estimated annual global sulfur emissions from 1860-1980. Source unknown.
Figure 9 -
Estimated sources of short-lived sulfur gases. Adapted from IPCC, 1992.
 Figure 10 -
The sulfur cycle in thebiosphere. J. D. Butler, Air Pollution Chemistry, 1979
Figure 10 -
The sulfur cycle in thebiosphere. J. D. Butler, Air Pollution Chemistry, 1979
 Figure 11 -
Simulated concentrationsof sulfate at 900hPa. IPCC, 1990
Figure 11 -
Simulated concentrationsof sulfate at 900hPa. IPCC, 1990
Figure 12 -
Formation/destruction of tropospheric ozone. Mckee, David J. 1994: Tropospheric
Ozone: Human Health and Agricultural Impacts. Lewis Publications, Boca Raton. 333 pp.
Figure 13 - Impacts of high levels of ozone. Mckee, David J. 1994: Tropospheric Ozone: Human Health and Agricultural Impacts. Lewis Publications, Boca Raton. 333 pp.
 Figure 14 -
Examples of plant yield loss induced by ambient ozone level in various states.
Figure 14 -
Examples of plant yield loss induced by ambient ozone level in various states.
 Figure 15 -
Summary of ozone concentrations predicted to cause 10 - 30% yield losses and summary of yield losses
predicted to occur at 7-h seasonal mean ozone concentrations of 0.04 and 0.06 ppm. McKee, David J., 1994: Tropospheric Ozone.
Figure 15 -
Summary of ozone concentrations predicted to cause 10 - 30% yield losses and summary of yield losses
predicted to occur at 7-h seasonal mean ozone concentrations of 0.04 and 0.06 ppm. McKee, David J., 1994: Tropospheric Ozone.
 Figure 16 -
Predicted relative soybean yield loss for 1987. McKee, David J., 1994: Tropospheric Ozone.
Figure 7, p 193. Reprinted with permission from CRC Press, Inc.
Figure 16 -
Predicted relative soybean yield loss for 1987. McKee, David J., 1994: Tropospheric Ozone.
Figure 7, p 193. Reprinted with permission from CRC Press, Inc.
 Figure 17 -
Predicted relative wheat yield loss for 1987.
McKee, David J., 1994: Tropospheric Ozone. Figure 7, p 193. Reprinted with permission from CRC Press, Inc.
Figure 17 -
Predicted relative wheat yield loss for 1987.
McKee, David J., 1994: Tropospheric Ozone. Figure 7, p 193. Reprinted with permission from CRC Press, Inc.
Related Class Images
 Exchange of gases
between ecosystem components and the atmosphere. Global Change
International Geosphere - Biosphere Programme, Report No. 12, 1990
Exchange of gases
between ecosystem components and the atmosphere. Global Change
International Geosphere - Biosphere Programme, Report No. 12, 1990
 Seasonal variation of surface ozone. Houghton, J.T., G.J. Jenkins,
J.J. Ephraums, eds, 1990: 1990 Intergovernment Panel on Climate Change, Cambridge University Press.
Seasonal variation of surface ozone. Houghton, J.T., G.J. Jenkins,
J.J. Ephraums, eds, 1990: 1990 Intergovernment Panel on Climate Change, Cambridge University Press.
 Summary of O3 concentrations predicted to cause 10 and 30% yield losses. Adapted from McKee, D. I., Tropospheric Ozone: Lewis Publications, 1994.
 Plant yeild loss due to tropospheric ozone. Adapted from McKee,
D. I., Tropospheric Ozone: Lewis Publications, 1994.
Plant yeild loss due to tropospheric ozone. Adapted from McKee,
D. I., Tropospheric Ozone: Lewis Publications, 1994.