|
|
|
|
|
|
|
|
|
|
|
|
|
|
 |
|||||||
|
|
|
|
|
|
|
|
|
||
Figure 2 - Global Mean Surface Air Temperature
Figure 3 - Surface Air Warming
Figure 4 - Sea Ice
Figure 5 - Sea Level Rise
Figure 6 - Sea Level Rise
Figure 7 - Impact of Increased CO2 on Ocean Circulation
Figure 8 - Percent Reduction in June-August Soil Moisture
Figure 9 - July Termperature for Southeastern U.S.
Figure 10 - July Heat Index for Southeastern U.S.
Figure 11 - The Climate Impacts LINK Project
Figure 12 - Modelled global mean temperature time-series for HadCM2CON, HadCM2GHG and HadCM2SUL
Figure 13 - Annual Temperature Change
Figure 14 - Annual Precipitation Change
 Figure 15 -
Average annual precipitation over the tropical Pacific Ocean. (Adapted from R. C.
Taylor, 1973: An Atlas of Pacific Islands Rainfall, Hawaii Institute of Geophysics, 1973)
 Figure 16 -
Flow lines for ocean circulation (Adapted from Stommel, H. Deep Sea Research, 1958)
 Figure 17 -
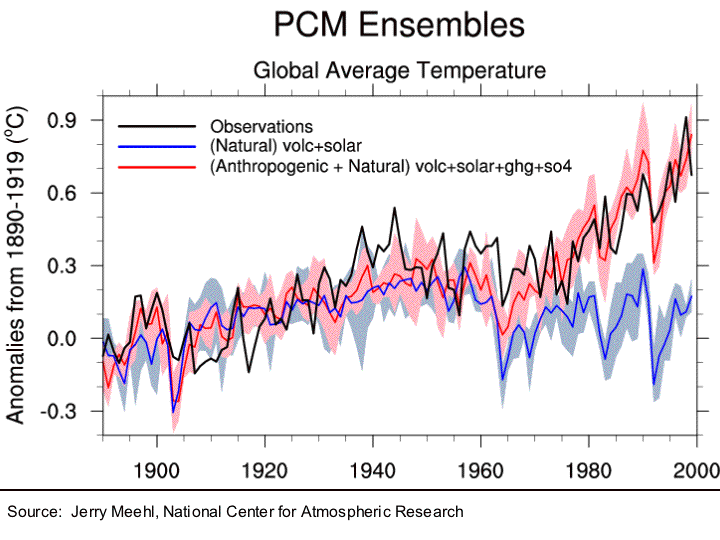
Predicted temps, based on greenhouse gases, versus observed.
Related Class Images
 Results from coupled atmosphere-ocean models transient simulation. IPCC 1992.
 Change in surface air temperature near time of CO2 doubling. IPCC 1992.
 GFDL transient model. IPCC, 1992.
 Regions of increased precipitation tend to be ocean areas. IPCC 1992.
Time-dependent temperature response vs. equilibrium temperature response. IPCC 1992.