
|
|
|
|
|
|
|
|
|
|
|
|
|
|
|
|||||||
|
|
|
|
|
|
|
|
|
||
Extreme Weather Events
and Regional Models
Extreme weather events have the most impact on human health and safety and on the economy.
The next series of plots show that capabilities of a regional climate model to simulate a flood event.
The summer of 1993 was a notable period in the Midwest US due to the occurrence of some of the most serious
flooding of the 20th century. Zaitao Pan, in his PhD dissertation at Iowa State University, used a
regional climate model to simulate individual events during this flood period. Measured
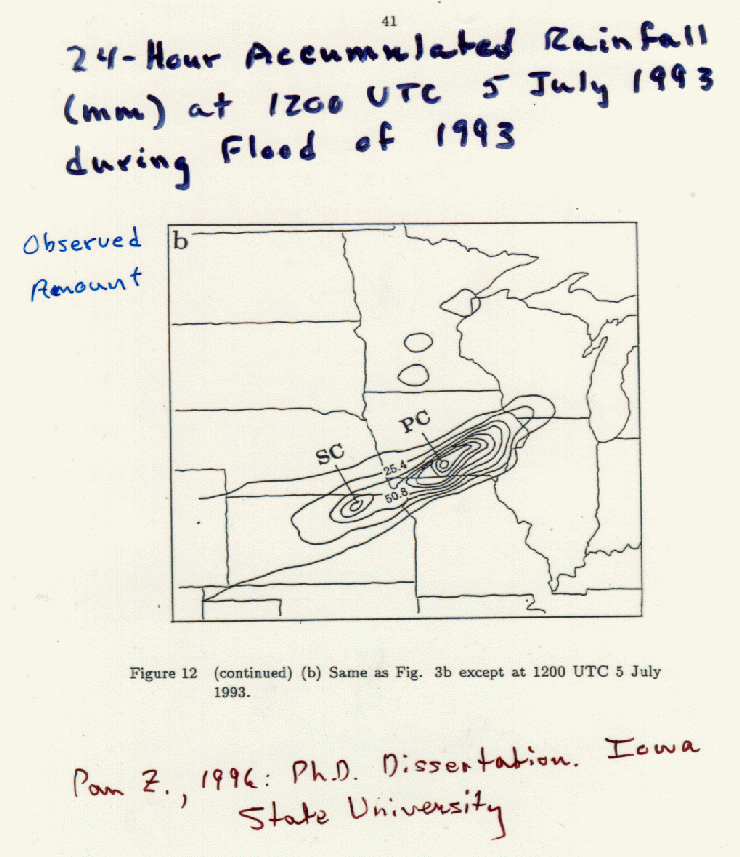
accumulated rainfall for the 24-hour period ending 1200 UTC 5 July 1993, Figure 15, shows a region of heavy
precipitation in Iowa and adjacent states with a primary center (labeled PC) and a secondary center
(SC). Maximum precipitation in the PC was about 115 mm (over 4 inches) with a secondary maximum
of over 2 inches at the SC.
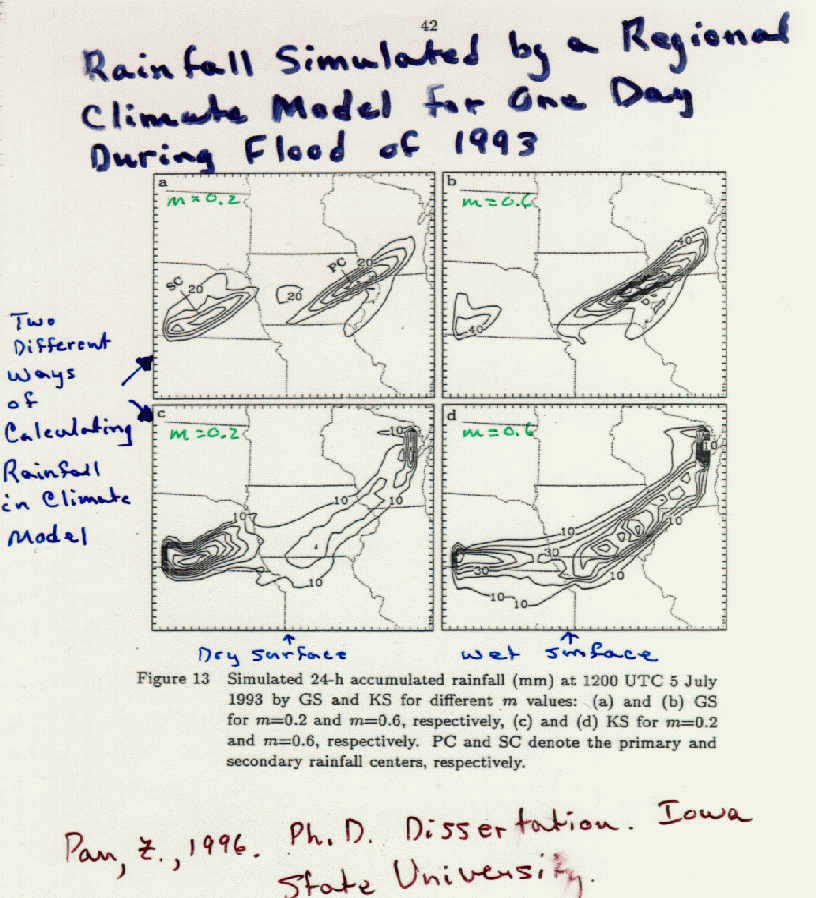
Model results using two different options for representing rainfall processes, Figure 16, show that different options have significant influence on simulated precipitation. The combination of model parameters used for plot (a) seems to give results most closely resembling the measurements, Figure 15. This option gave two centers, with PC having a maximum precipitation amount of 120 mm and a secondary center with maximum of 80 mm. The simulated SC is too far west and the PC is too far east, but the precipitation footprints are quite close to the observed.
In part (b), Figure 16, the soil moisture in the model was assumed wet as compared to an assumption of dry soil for Figure 12(a). The result is that PC has more precipitation and SC has less. Evidently, the influence of soil moisture is complicated and may either increase or decrease resulting precipitation.
Figures c and d, Figure 16, give results of a different model option for dry and wet soil, respectively. Dual centers are simulated with this option also, but resemblance to observations is poorer than simulations a/b.
A second event (9 July 1993) during the flood year also has two precipitation maxima in the 24-hour accumulation, Figure 17. The model results for this event also revealed two centers as observed. Amounts and exact location show differences from observations.
An additional simulation, Figure 18, for 9 July with several different soil moisture values reveals that as surface moisture increases, more rain is produced in the primary center and less in the secondary center. A more detailed analysis of upper-air conditions revealed that the primary center had sufficient instability at upper levels and only needed more moisture (which was supplied by a more moist surface) to produce more rain. By contrast, the additional surface moisture produced less, not more, precipitation at SC. The reason for this was that the SC needed more surface heat to stimulate convection to enhance rainfall. But a more moist surface did the opposite: it cooled the surface and actually suppressed rainfall.